Archive for Baseball

How To Use R For Sports Stats: Visualizing Projections

If you’re reading TechGraphs right now, there’s a good chance you’re prepping for fantasy baseball, and if you’re doing that, there’s a good chance you’re making use of projection systems like Steamer or ZiPS. In this post, we’ll explore some basic tools that might help you look at these projections in a new way — and brush up on those R skills that you probably haven’t touched since last fall.

(From a skills perspective, this post will assume that you’ve previously read through the “How To Use R For Sports Stats” series. Even if you haven’t, the insights below will hopefully still be worth your while. I’d also be terribly remiss if I didn’t point you towards Bill Petti’s recent THT post unveiling his baseballr R package.)

We’ll use Steamer projections for this post, though the methods we’ll look at can be used with ZiPS, FG Depth Charts, or, for that matter, actual by-season data. Download Steamer’s 2016 batting projections from FanGraphs, rename the file to “steamer16.csv”, and load it up in R. We’ll remove players projected for fewer than 100 AB to clean up the data a bit:

steamer = read.csv("steamer16.csv")
steamer = subset(steamer, PA > 100)

Visualizing Tiers

As fantasy baseball managers, we all have an innate ability to estimate a player’s value from their stats, judging how good a 30/10/.285 player is vs. a 15/15/.280. We get pretty good at this if we want to do well in our leagues — but we can still develop blind spots in our assessments, or hold on to an outdated idea of quality as MLB trends change. (For example, the average AVG in MLB has dropped from the high .260s 10 years ago to the low .250s today; if you’re still thinking a .255 hitter is below average, you might want to reconsider.)

The point, then, is that if you’re getting a sense of how good a player will be by looking at their projections, it can be helpful to step back and recalibrate your thinking from time to time by looking at the broader trends in an image or two.

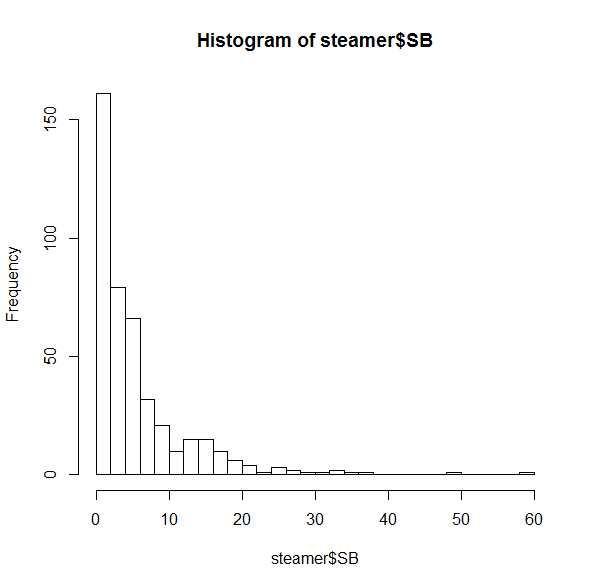
Let’s look at Steamer’s projections for stolen bases, for example. We’ll draw on what we learned back in part 2 to make a quick-and-hasty histogram counting the number of MLB players who are projected for different SB totals:

hist(steamer$SB, breaks = 30)

Basic histograph of SB projections

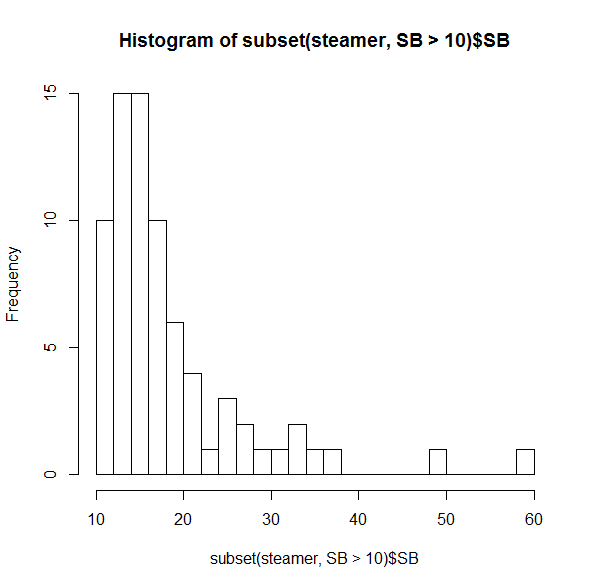
Most of these players are projected for fewer than 10 SB. This is sort of interesting, but their huge counts are keeping us from seeing the trends on the right side. Let’s zoom in a bit:

hist(subset(steamer, SB > 10)$SB, breaks=30)

Histograph of SB projections for > 10 SB

Even among this crowd of speedsters, it’s uncommon to see someone projected for more than 20 SB, and incredibly rare to have more than 30.

You probably didn’t need to be reminded that the two folks on the far right (spoiler alert: Billy Hamilton and Dee Gordon) would stand out, though it’s useful to see just how distant they are from everyone else. But if you were thinking that players like Jarrod Dyson (35 projected SB) or Billy Burns (32) are solid, but not elite, on the basepaths, it may be time to reassess. (Did I mention that SB totals in MLB dropped 25% between 2011 and 2015?)

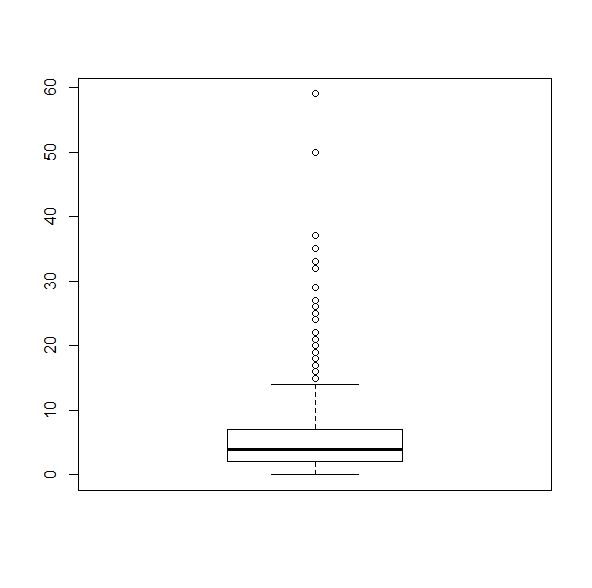
If you’re the kind of person who prefers boxplots instead, R’s got just the thing:

boxplot(steamer$SB)

Boxplot of SB projectionsThis makes it as plain as possible that any player projected for more than about 15 SB is, quite literally, a statistical outlier.

20/20 Vision

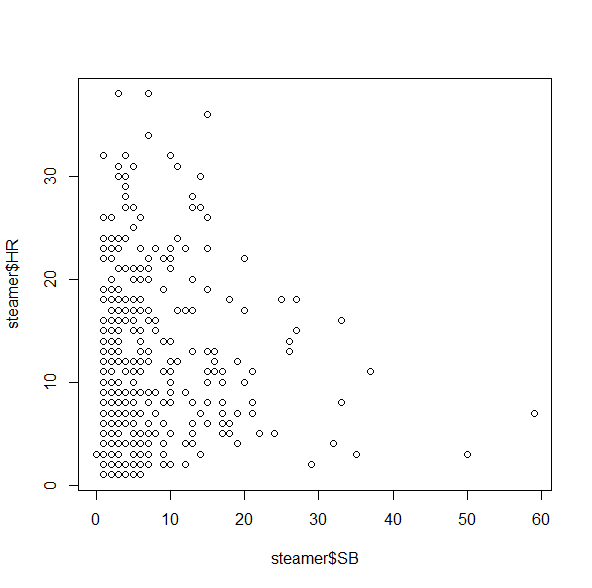
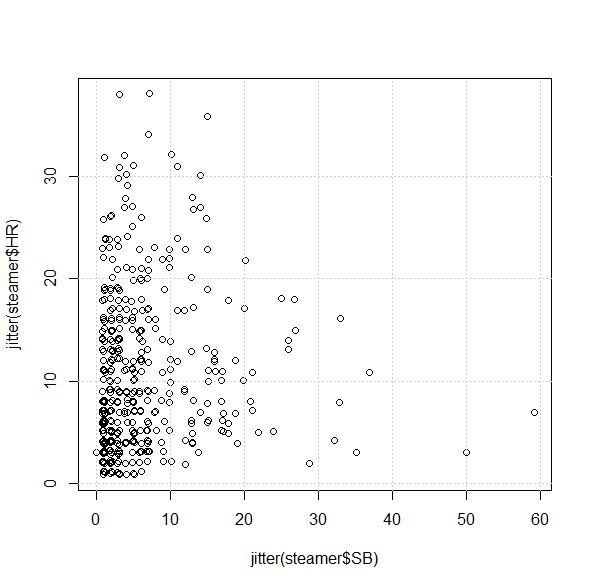
The same idea goes for getting a grasp on multi-category players. Most of us are looking for players who can bring in both HR and SB, but how many of those are really available? Let’s do a quick 2D plot:

plot(steamer$SB, steamer$HR)

Basic plot of HR vs. SB projectionsThis isn’t bad, but unfortunately it doesn’t give us a good sense of how many players fall into each category, since there’s only one dot for all of the 5 HR/3 SB players, one dot for all the 2 HR/4 SB players, etc. A quick workaround for this is the jitter() command, which moves the points around by tiny increments to get rid of some of the overlap:

plot(jitter(steamer$SB), jitter(steamer$HR))

And, for good measure, let’s add a grid on top:

grid()

Your plot should now look something like (but not exactly like) this:

Detailed plot of HR vs. SB projections

From the chart, we can see that it’s not impossible to find players projected for 30/10 or 10/30, but it looks like there’s only one 20/20 guy in Steamer’s projections:

subset(steamer, (SB >= 20 & HR >= 20))

            Name   Team  PA  AB   H X2B X3B HR  R RBI BB  SO HBP SB CS X.1   AVG   OBP   SLG   OPS
40 Carlos Correa Astros 636 571 157  33   3 22 80  82 54 110   4 20 11  NA 0.275 0.339 0.458 0.797

Of course. As if being a 21-year-old SS with plus average wasn’t enough.

Fun With Subsets

Let’s close this out by doing a bit more with subset() — possibly one of R’s most useful tools for our purposes because it’s just so much quicker and more customizable than online tools or Excel.

Say you want to find the prospective “five-category players”; you may have a sense of who some of the candidates are, but you might be surprised by what the numbers actually suggest. How many players, for example, are projected to do better than 10/80/80/10/.275?

subset(steamer, (HR > 10 & SB > 10 & R > 80 & RBI > 80 
 & AVG > .275))

               Name         Team  PA  AB   H X2B X3B HR   R RBI  BB  SO HBP SB CS X.1   AVG   OBP   SLG   OPS
1        Mike Trout       Angels 647 542 166  32   5 36 104 104  90 138   8 15  6  NA 0.307 0.410 0.585 0.995
5  Paul Goldschmidt Diamondbacks 652 543 158  36   2 30  93  93 100 142   3 14  7  NA 0.290 0.401 0.531 0.931
7  Andrew McCutchen      Pirates 653 554 165  34   3 23  88  87  84 123   9 12  6  NA 0.297 0.395 0.496 0.891
25    Manny Machado      Orioles 663 597 170  35   2 27  91  87  53  99   4 14  8  NA 0.285 0.345 0.484 0.829

Fewer than you may expect–which could well make them all the more valuable.

Conclusion

Projections, of course, are just projections, and you shouldn’t take one set — or even a combination of sets — to be a true predictor of what will happen this season. But if you typically look up projections player-by-player, or if you’re disinclined to take in a huge wall of stats at a single glance, looking at the broader trends in individual visualizations can help keep you on the right track as you prep for this fantasy season.

Here*, as always, is the code used for this post. If you have anything else you’d like to see us do with R as the new season comes near — or any suggestions with what you’ve used R for — let us know in the comments!

*download the ZIP and extract the R file.

Motus, Zepp Unveil New Wearable Baseball Tech at CES 2016

Motus Global and Zepp announced new additions to their existing lineup of baseball-specific wearable devices at this week’s Consumer Electronics Show in Las Vegas.

Motus Global’s system, called motusBASEBALL, is driven by a single IMU sensor. The new system can be used in a compression sleeve to track pitching, comparable to the mThrow, their existing offering. But the motusBASEBALL system can also be clipped on to a batting glove, providing feedback on a player’s swing.

“Our unique approach to the space, rooted in years of biomechanics services for MLB teams, along with the most powerful sports sensor on the market, gives our users the best chance at improving their mechanics and monitoring workloads on their joints,” said vice president for application development Ryan Holstad.

Preliminary information about the system is available on Motus Global’s website. The pitching metrics offered are very similar to the mThrow: both include throw limits based on workload, elbow and shoulder kinematics based on the single IMU worn over the ulnar collateral ligament, and a “bullpen mode” to help pitchers train.

The webpage also suggests that six metrics will be tracked for hitters: bat speed, hand speed, swing time, swing length (in inches), attack angle, and vertical angle. Metrics will be calculated separately for each region of the strike zone, to help hitters identify “hot” and “cold” regions. (Pitch locations will presumably be entered manually.)

To this point, not much has been revealed about the sensor driving the new system, other than that it has been “upgraded” over the current mThrow sensor. We can say for sure that the new sensor is less rounded than the current one. There is also a micro USB port for charging the sensor, a change from the induction charging previously used. More details will be revealed in the weeks leading up to the device launch (currently scheduled for February).

The company emphasized that motusBASEBALL was a consumer system, contrasting it with the motusPRO system unveiled during last month’s Winter Meetings. A full-body, five-sensor system, the motusPRO also transmits data via Bluetooth to a mobile phone or tablet for analysis. The system describes hitting and pitching motions through a wide range of angles, forces, rotations, and timing parameters. The motusPRO is currently available only to professional organizations, but Motus Global plans to roll the device out to select training facilities in the future.

Also this week, Zepp announced the next evolution of their bat sensor: an as yet unnamed offering embedded directly into the handle of the bat. As seen in the image above, the sensor will lock into a retention sleeve, which in turn will be fitted into the hollowed-out knob of a bat. Current offerings, which fit into flexible sleeves that slide over the knob, can move around or be knocked off by especially violent swings. Moving the sensor inside the bat should mitigate this problem.

The new design is still in the prototype phase, and no price point or release date have yet been announced. But Zepp claims to be in talks with a number of bat manufacturers to make a commercial version. In addition, Zepp announced a partnernship with New Balance, who unveiled a new digital sport division at CES.

Meanwhile, Zepp also has representatives at the annual convention of the American Baseball Coaches Association in Nashville. The goal there is to advance Zepp’s new design as an “open-source” industry standard for wearable sensors. To that end, the company will be hosting a roundtable discussion on this topic Friday.

Currently, devices like Motus Global’s and Zepp’s are not approved by MLB for in-game use. But MLB has said they are updating their wearables policy before the 2016 season. Until then, these devices can be used in practices and specific events: Zepp’s existing sensor has been used during game action at Perfect Game showcases, and an early version of the mThrow was used during 2014 fall instructs.


MLB Teams Demo New Tech During Fall Instructs

After quietly toiling away all summer, they travel to the complexes in Arizona and Florida just after the minor league seasons end. Now is the time to impress the higher-ups that will decide their future with the organization.

It seems the startups traveling to the Arizona Fall League and fall instructional leagues have more in common with the prospects they work with after all.

MLB teams use the fall instructional leagues (“instructs”) to try out new technologies they are considering purchasing. Organizations get to use their minor league talent as guinea pigs, rather than their stars. And tech companies get more access to players than they would during spring training or the regular season, when their schedules are much more regimented.

The result is a who’s who of baseball-related companies making their way to the Arizona and Florida. Over the past year, deCervo, Motus Global, SmartKage, and Zepp all reported spending time at fall instructs, and that’s just the companies I’ve personally written about. Motus brought their pitching sleeve — later officially christened the mThrow — to last year’s fall instructs, where they reported metrics such as arm slot, arm speed, and elbow torque to coaches during game action.

“Fall instructs serves as a great platform for Motus to work with our existing lab partners on new developments while we transition our biomechanics lab experience to the field,” chief technology officer Ben Hansen said.

Teams are always looking for new products to test out. Suggestions for new devices can come from anywhere: training staffs reading about a new technology, or front office members suggesting products they or their colleagues have used before. But there’s a significant effort needed to try new devices, so organizations have to narrow their choices down to the most promising options.

“In almost all cases, the decision to evaluate technology involves more than one department buying in,” said Rangers’ director of baseball information services Todd Slavinsky.

Once a decision to work with a particular technology is made, the technology is evaluated on a number of fronts. Slavinsky said the Rangers pay special attention to making sure the device is unobtrusive for the players who use it and produces clear, actionable information for coaches and trainers.

“Ease of use is key,” he said. “And the ability to import results into our internal systems is important.”

Part of the evaluation process is determining how, if a device is designed for in-game use, data collected outside of a game environment relates to data collected during competition. And this is where fall instructs provide a unique opportunity for organizations: In contrast to the regular season, there are relatively few barriers to in-game use during instructs. MLB currently prohibits the on-field use of technologies like bat sensors during games (though a new policy is in the works for next season). But unlike spring training or even the Arizona Fall League, fall instructs are not sanctioned by Major or Minor League Baseball. And since these games are more of a very organized scrimmage than their officially sanctioned counterparts, rules about things like on-field technology are made by the participating clubs without the involvement of MLB.

Startups are understandably excited to get an invite to fall instructs. Jason Sherwin, founder and CEO of deCervo, worked with four teams this fall: two teams with whom he had an existing relationship, and two new organizations. A veteran of spring training, Sherwin said the less stringent schedules of fall instructs makes life easier for people like him, who need to grab players between games and workouts and batting practices.

“During the season, the schedule’s more set … and the priority is on the players being ready for the game,” Sherwin said. “So there’s a lot less room for us to fit in there.”

But in the spare moments at instructs, Sherwin and his colleagues had a chance to test the minor leaguers available to them using their full EEG system. Naturally, most of the players had never heard of deCervo’s brain training techniques. But Sherwin said he was encouraged by the feedback his group collected from the users.

“It was a very positive response from the players,” he said. “They’d like to use it on their phone, they thought it was cool, that sort of thing.”

But it wasn’t all smooth sailing for deCervo. Sherwin said his group witnessed “sparring” within organizations between those who were excited about the technology, and those who hadn’t heard of it and were more skeptical.

“Because what we’re doing is such a different approach to hitting, the process is more by exposure,” Sherwin said. “So there is a little bit of a hump to get over in terms of willingness to change or work it into the already busy schedule.”

Now that the instructs season is over, the technology companies are back in the lab, analyzing the data they collected from the pros to see how they can improve their products. And front offices are gathering too, poring over their new data sources and trying to determine if they are worth a longer look.

“In the end the decision to move from evaluation to adoption would be based on positive feedback … along with strong buy-in from multiple departments that the results will yield a real competitive advantage,” Slavinsky said.


Scoutee Pairs Handheld Radar Gun with Smartphone App

Slovenia probably isn’t the first country you’d expect new baseball technology to come from. But they do have a baseball league and a national team (trounced by such powerhouses at Bulgaria, Ukraine, and Slovakia at this summer’s European championship qualifiers). And it’s this Balkan country that’s produced the Scoutee, a handheld radar that its creators hope will help those just learning the game measure themselves.

According to Scoutee, the first prototype of the device was created last summer. Design was completed over the past year, and the device is now available for pre-order through a Kickstarter campaign. Of the four co-founders, only chief executive officer Miha Uhan came into the project with experience playing baseball. I asked if his fellow Scoutee developers even knew about baseball when they started the project.

“They sort of knew,” he said. “The hardest thing for our team was actually the technical point, not the baseball point.”

Naturally, the product is small, weighing around half a pound. The Scoutee can attach to a tripod or be clipped to a fence, but also ships with a magnetic sticker so users can attach the device directly to their smartphone. Inside is a Doppler radar transceiver, hardware to perform amplification and other signal processing, and a low-energy Bluetooth transmitter to send the readings to the user’s phone or tablet. Scoutee also claims a battery life of up to six hours, and a range of up to 130 feet. For most amateur games (which seems to be Scoutee’s target demographic), that should be just enough for someone positioned just behind the backstop, which is supposed to be 60 feet from home plate (or about 120 feet from the pitching rubber).

The most common question Scoutee fields is related to the device’s accuracy. Scoutee claims to be accurate to within one mile per hour, based on side-by-side tests with traditional radar guns. Tests have been performed with both human pitchers and (because the pitchers available during testing never broke 90 mph), with a high-velocity pitching machine to test the device’s accuracy at speeds over 100 mph. Additional ballistic tests are planned by Scoutee’s technical team to establish the device’s accuracy for objects moving at a known speed.

Though designed with baseball applications in mind, the Scoutee is at heart a radar gun, and thus has a number of other potential applications. Scoutee’s Kickstarter comments page is filled with suggestions for other uses, all of which Uhan claims are possible with the existing hardware but may require additional algorithm and app development.

“We got requests from national ski associations, they want to measure how fast their skiiers go,” Uhan said. “We even got requests or emails from people who want to measure the speed of cars in their neighborhood.”

Uhan, along with Scoutee’s chief marketing officer Majda Dodevska, have been touring the United States since early September to spread the word about the product. Scoutee has made appearances at TechCrunch Disrupt’s Hardware Alley, and will be present at this week’s Hashtag Sports Fest. Scoutee is also making contacts with companies interesting in importing Scoutee measurements into their existing apps (though Dodevska wouldn’t mention any specific organizations at this time).

“We’re definitely open to any type of cooperation,” Dodevska said. “If anyone wants to talk to us about anything, we’re here.”

Any down time the team has is spent meeting with coaches, scouts, players, and parents, demonstrating their product and collecting feedback. Uhan said prospective users are always surprised when first introduced to the technology.

“It seemed really strange that if it is technically possible then nobody has done it before, and that’s what we heard over the last 12 months,” Uhan said. “Everybody we talked to and we showed our prototype was like, ‘Okay, you must be kidding me right? This thing exists already,’ and we’re like, ‘No! No!'”

Uhan’s moment of inspiration was a long time coming. His first introduction to baseball came on a 1997 trip to the United States, when he went with his family to a game at Jacobs Field. That was the Indians team that lost in Game 7 to the Florida Marlins, facing a Mariners team that included Alex Rodriguez, Randy Johnson, Edgar Martinez, and Ken Griffey, Jr. Uhan pestered his American relatives with questions, and brought a love of the game back home with him.

“It was so, so nice to be there in the stadium and to watch the game and to experience that all,” he said.

Once back in Slovenia, Uhan began playing with a local team. Soon after, he was invited to join the national team (“You get noticed because there is not a lot of competition,” Uhan admitted) and became a pitcher. Within a year — and before he even understood all the rules of baseball — Uhan was traveling with the junior national team to a tournament in Switzerland.

By the time he was in high school, Uhan was sitting mid-80s, playing for the senior-level national team, and traveling with his coach to the MLB elite camps. One of his teammates played for a bit in the Mexican League, but Uhan wanted to play college ball in the U.S. He borrowed a directory of colleges from the American embassy and emailed every athletic department in the book. Of the thousands of emails he sent, only a handful got back to him. But the responses discouraged him further.

“Everybody said, ‘Yeah, sure, just send us some stats, send us some videos,'” Uhan said.

With no statistics available from his national team days, and no video or scouting reports available to him, Uhan couldn’t make an impression on his would-be college coaches. He ended up attending the University of Ljubjana in the Slovenian capital, and his baseball career ended. As a lecturer in the school’s faculty of economics, Uhan was bitten by the entrepreneurial bug and found inspiration in his former passion. He soon after partnered with fellow faculty members who specialized in electrical engineering (especially radar systems), and they began developing what would become Scoutee.

“Because we don’t have a technical background, we contacted some people who we knew in Slovenia that had the hardware knowledge,” Uhan said. “It was a challenge, but if it wasn’t a challenge then probably somebody would have done it before.”

Uhan recalled that, in his playing days, the radar gun was a rare sight. The only one available to the national team was old and on its last legs, so Uhan and his fellow pitchers didn’t have many opportunities to measure their progress. Scoutee’s goal is to make these sorts of metrics accessible to anyone with a smartphone, with the hope of growing baseball in fledgling markets like Slovenia.

“We’re actually crowdsourcing the scouting process, that’s the idea,” Uhan said.


SmartKage Helps Scouts, Teams Evaluate Players

SmartKage’s headquarters are in a remote office park, 36 miles and a couple dozen cows away from Boston. But in a batting cage inside, Kevin is warmed up and ready to audition before an audience of MLB scouts and college recruiters from across the country.

Kevin, a 14-year-old shortstop (whose name has been changed for this story), and his father are listening to SmartKage chief operating officer Larry Scannell describe the components of the infielder test. Scannell, a former Red Sox farmhand, runs through the sprinting, agility, throwing, and hitting portions of the test.

“It’s analogous to a physical SAT,” Scannell says. “And if you take it multiple times, just like the SAT, we combine your best scores in each area. It’s not about consistency, it’s about capability.

Once the explanation is over, a few taps on a touch screen start the automated measurement process. The system has been designed to be completely automated. Aside from tapping “next” on the touch screen, no human intervention is required, though Scannell adds the occasional explanatory detail or words of encouragement. And as Kevin takes his hacks against the pitching machine, Scannell and director of information technology Dennis Clemens starts talking about the collaboration with FungoMan that was required to making the pitching machine as consistent as possible.

“We changed out the legs and bolted the machine down,” Clemens said. “The side-to-side adjustment was removed, and we had the agitator adjusted so there were fewer jams.”

“And we swap the balls out every 30 days,” Scannell added. “We’re working with Rawlings and talking about the life of a baseball. And as a former facility owner myself, I mean, these are pearls! We would use these for an entire year, you know? Now …”

“Now the dog eats them,” CEO Corrine Vitolo said. “We take the premise of standardization very seriously.”

The fresh baseballs are more than just a way to give Merlin, a German Shepherd mix who was also on hand, new chew toys. Developing and running a standardized test requires SmartKage to constantly calibrate and maintain their equipment. It also means a significant effort to find the right kind of facilities to partner with, and Scannell said he spent five years evaluating prospective partners.

“I vetted these facilities out on location, years in business, member base and foot traffic, and then the size and the appearance,” he said. “But most importantly, are they going to bring in the business and support it?”

To date, SmartKage has reached agreements with 160 facilities across the country. They began their initial rollout earlier this year, and are currently up and running in about 20 facilities. The company owns the equipment and installs it in the facilities, who then advertise the product to their clients. The tests run around $150, and take around 30 minutes. Different tests exist for infielders, outfielders, catchers, and pitchers; the results are available to professional teams and college programs, with especially high marks forwarded directly to teams.

“We’re a filter and a pre-qualifier for teams,” Scannell said. “It’s about maximizing the time and productivity for scouts.”

Vitolo said her company also has more in-depth relationships with a number of MLB teams (though she refused to say which). These teams lease systems to gauge the fitness and health of their own players. Scannell said the teams also buy prepaid “scout cards” that area scouts give to amateur players they’d like more information on, and that professional players already in the organizations use in the offseason to track their workouts.

“And because we weigh them every single time, we’ll know if they come in overweight before they get into spring training,” Scannell said.

smartkage_sample
Sample speed and agility data from a SmartKage testing session (courtesy of SmartKage).


The batting cage where the test takes place looks a little unusual. Laser timers are stationed at regular intervals along the length of the cage to track the athlete during speed and agility tests (though these are removed, of course, before hitting begins). The area around home plate is slightly elevated: the platform contains pressure sensors to track things like how a hitter’s weight is distributed during the swing. And hanging from the ceiling are two cameras, evidence of an automated version of Sportvision’s PITCHf/x technology that tracks both incoming pitches and batted balls.

“What we’re doing is we’re bringing these technologies from the major league level, we’re trickling them down through the amateur and collegiate market,” Vitolo said.

Sportvision, of course, should be familiar to tech-savvy baseball fans; their PITCHf/x pitch tracking data have been publicly available since the system was first installed in 2007. And their HITf/x and FIELDf/x technologies have also been available to teams for several years. Soon after their founding, Vitolo said SmartKage began their partnership with Sportvision, ensuring that the same data sources front offices were using to evaluate their professional pitchers and hitters would also be available to judge prospective draftees.

“So when they’re making comparative analysis between players, it’s exact, it’s apples to apples,” Vitolo said. “[Sportvision is] the de facto standard in baseball, and we worked with them on adding metrics to their existing system.”

Even after only a few months, SmartKage is already finding interesting trends in their data. Scannell described how players, after years of counterclockwise baserunning, become almost universally faster going to their right than going to their left. And he also talked about how the technology helped find an injury from a pro pitcher’s plyometric pushup data.

“There was an abnormal kind of regression in one of the pitching shoulders,” Scannell said. “And it turned out that there was a slight tear, and it was enough to red flag an MRI.”

The team is busy completing its first 40 installations, and making plans to roll out to the other facilities they have agreements with. But look in the right places and you’ll see hints — like a Harvard football helmet perched on a filing cabinet — that the company is starting to expand their offerings.

“A lot of the facilities that Larry’s got under contract are multi-sport facilities,” Vitolo said. “So you’ll have a SmartKage baseball, and then you’ll have a SmartSports football.”

Just like the SmartKage, SmartSports Football will offer an automated evaluation tool — a “physical SAT” — to a sport known for its pre-draft scouting combine. But Scannell says the company will offer far more than the handful of metrics traditionally covered.

“We measure five times the amount of metrics as the NFL combine,” Scannell said. “We can do everything the NFL does plus another five times those metrics in addition.”

As more and more of the cages start to appear across the country, the technology that underpins them will improve. SmartKage already has plans to add even more data sources, from pressure sensors in the pitching mound to markerless biometrics to wearable sensor-based technologies. To an outside perspective, digging into a specific aspect of a player’s game from the all the information SmartKage makes available may seem like trying to drink from a fire hose. But Vitolo says her company is ready to adapt to any improvements in technology — and still meet teams’ growing demand for performance and biometric data.

“Leap and the net appears,” Vitolo said. “You have the technology, you’ve got the capacity, and all of a sudden the applications present themselves.”


TechGraphs Report: On Deck Sports and Technology Conference

Earlier this week, NYC’s Bohemian National Hall played host to hundreds of sports executives, entrepreneurs, and others looking to learn about the very latest in sports technology. Since 2013, the On Deck Sports and Technology Conference (organized and presented by SeatGeek) has provided a forum to showcase what products are “on deck” to help fans follow, analyze, and participate in sports.

On Deck has a slight bent towards sports startups, so a decent amount of the conference was geared more towards raising capital, scaling businesses, etc. Still, there were plenty of fascinating talks, panels and interviews for anyone interested in straight sports tech.

Statcast And Beyond

Possibly the most entertaining talk of the day was Joe Inzerillo’s (CTO, MLBAM) update on MLB’s Statcast, which is finally getting its moment in the sun this season. For those who needed a refresher on how Statcast operates, Inzerillo discussed its missile-technology radar system, its stereoscopically-placed cameras, and how these allow each Major League ballpark to track the movements of every player on the field (plus the ball) at any given time.

Once Statcast has this information, as Inzerillo pointed out, it can then provide real-time data on pitch velocity (actual and perceived), player velocity and reaction time, and a horde of other quantitative metrics, plus more advanced data on a 12-second delay, like fielding route efficiency. This data is just inherently cool (as you likely know if you’ve seen a Statcast-enhanced game or highlight on television), but it’s also already being used to both question and confirm existing baseball strategies.

For an example of the latter, Inzerillo looked at the fallacy of sliding into first using Statcast to plot Eric Hosmer’s 1B slide in Game 7 of the last World Series. Hosmer hit a peak speed of 20.9 MPH before sliding and being out by less than a tenth of a second. If he had just kept running, Statcast found, he would have been safe by nearly a foot. Statcast is already getting noticed by clubs, and even players — batters like to talk smack, apparently, over who has the highest exit velocity.

During questions, Inzerillo was slightly cautious about committing to the future of Statcast, but he did mention that minor league stadiums were a natural next step, and that there was plenty of work being done on developing new metrics. Statcast already tracks ‘defensive range’ for fielders, for example, but since a player doesn’t travel the same speed in every direction, there’s a need to find the more amorphous ‘effective defensive range’ and how it changes–such as during defensive shifts.

On the football side of things, Sportradar’s Tom Masterman talked about the NFL’s NGS (Next Gen Stats) platform, which is collecting data on every single game in 2015 to track, analyze, and visualize how players are moving on the field. NGS is already being distributed to clubs, media, and health and safety personnel; the long-term goal is to have X,Y,Z coordinates for every player and official, plus the ball.

Go Bucks

On Deck’s attendees weren’t just league officials and startup managers–the conference started with a live interview of Wes Edens, who became co-owner of the NBA’s Milwaukee Bucks in 2014. Much of the conversation focused on the new Bucks arena, which was being voted on by the Milwaukee city council literally as the interview was ongoing. As it’s currently planned, the presently-unnamed arena will focus heavily on keeping fans digitally connected — giving attendees plenty of WiFi, for example. At the same time, Edens noted, they want to avoid fans using technology to become distracted from the game going on in front of them. (Edens used the phrase “Instagram culture”, specifically, though he noted that he himself has had these sorts of problems before.)

Edens was similarly balanced when the discussion turned to analytics. One of the first things Edens did after buying the Bucks was to build their analytics program — bringing on employees, consultants and even discussing methodologies with other owners. There’s definitely a “golden age” of analytics in basketball going on.  Edens even thinks the NBA will end up surpassing the MLB as the leader in sports technology. But when he was asked about how the players feel?

“It’s a good question,” Edens replied. “There’s definitely lines that can be crossed” with having too much data being made public, at least when it can affect the privacy of the players (such as rest/injury issues).

Edens also briefly discussed the role of the referees and the potential benefits of replay and “the new center across the river“. Could we see yet more referee technology, even an Oculus Rift-type headset for NBA officials, in the future? “Totally possible.”

Era of Mobility

When it came time to look at how fans themselves were interacting with sports, technologically, it became clear that mobile is “it.” In that panel about growing sports startups I mentioned earlier, representatives from SeatGeek, FanDuel and Krossover all praised the importance of the mobile web for their companies–SeatGeek’s rep described it as a “tale of two companies”, pre- and post-mobile, and Krossover’s founder mentioned they’re considering dumping their web app altogether in lieu of just being on smartphones and tablets. When Yahoo Sports’ VP of engineering presented a chart showing their fantasy football traffic from this season’s Week 1, the fraction of non-mobile data was a pretty small sliver at the top.

Yahoo fantasy data graph
Trust me, it’s there.

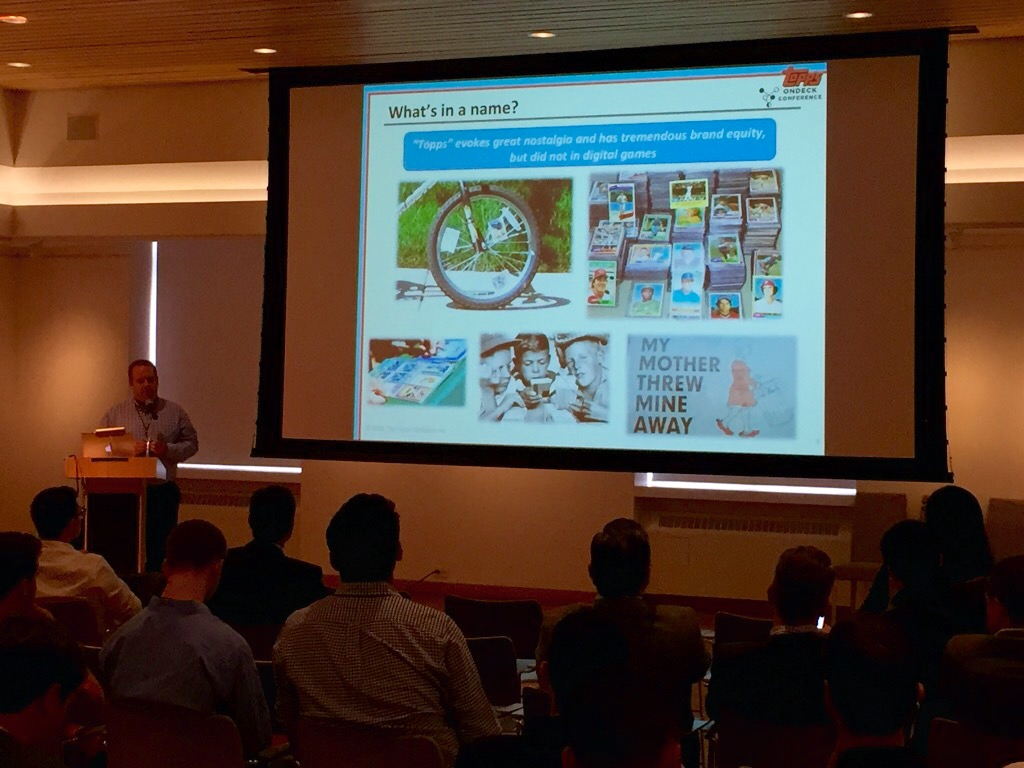
Even companies you might never expect to get in the mobile game are joining and succeeding. Jeremy Strauser had 20 years of gaming experience at EA Sports and Zynga before joining one of the most loved and enduring brands in the sports industry, Topps. Yep, they’re digital playing cards.

Topps first got into the digital game 4 years ago and how has three top-selling sports card apps, plus a newly launched Star Wars-themed set. Why should you be interested in buying trading cards on your phone? One starting point is the capabilities the digital platform provides — literally hundreds of thousands of different designs, the ability to create all manner of rare and unique cards, etc.

Topps is also rolling out a daily fantasy sports feature (DFS was a major topic of conversation at On Deck) that allows you to compete using the players in your card deck and swapping them in and out in real time as they go up to pitch or bat. It probably doesn’t hurt, either, that they won’t take up space under your bed or get thrown out by your mom when you’re away at college.

Topps conference talk

Coming To Your Hometown

If you want to look for the next wave of sports technology, though, look to your neighborhood.

Rather than providing new tools or analytics for MLB, the NFL or the NBA, the newest sports apps want to help you participate in sports in your own town. On Deck wrapped up with a “Startup Pitch Contest” a la Shark Tank where teams had four minutes to present their groundbreaking app to a group of judges. The six competitors included:

  • Wooter – a search engine for finding and joining sports and activities like local rec leagues. Wooter provides profiles for leagues looking to form teams, players looking to join them, and the tools to process payment and set up other logistics.
  • NextPlay – helping youth coaches conduct tryouts and league drafts. For $15/month, instead of taking a stopwatch, a bunch of handwritten notes, and an Excel spreadsheet to put together youth rosters, NextPlay handles all the data collection and analytics itself. Their beta has been used by “a couple hundred organizations” and over 10,000 athletes.
  • ScoreStream – filling a gap in local journalism by crowdsourcing reports on high school sports.

With a really impressive presentation, broad coverage (10,300 HS games covered last week alone) and the #1 iOS app for high school sports, I really thought Scorestream would walk away with the prize, but it ended up going to…

  • SidelineSwap, a P2P marketplace for sporting goods. SidelineSwap has over 43,000 registered users who’re interested in trading out sporting gear just collecting dust in their basement or garage. They’re working on building partnerships with youth organizations and promoting used college-branded material, which should play very well with their chief audience of high school students.

On the whole, On Deck was a whirlwind experience for learning about cutting-edge sports tech. This report only covers part of everything I caught there. Watch for further updates and profiles soon!


How David Ortiz Keeps Hitting Homers

On September 12, David Ortiz led off the top of the fifth inning by turning on a Matt Moore curveball, depositing it into the Tropicana Field bleachers for his second home run of the day and the 500th of his career. Ortiz became the 27th MLB hitter to reach the 500-homer milestone, and (at 39 years and 298 days) the fifth-oldest.

Ortiz didn’t get regular at bats until his age 24 season with Minnesota, and when he first came to the Red Sox, he shared the DH role with the immortal Jeremy Giambi. Contrast that with fellow Dominican and 500-homer man Albert Pujols, who had already played three full seasons by that age and collected 114 home runs as the Cardinals’ everyday left fielder. How has Ortiz managed to overcome this late start and defy the aging curve to hit dingers long after other sluggers have seen their power decline?

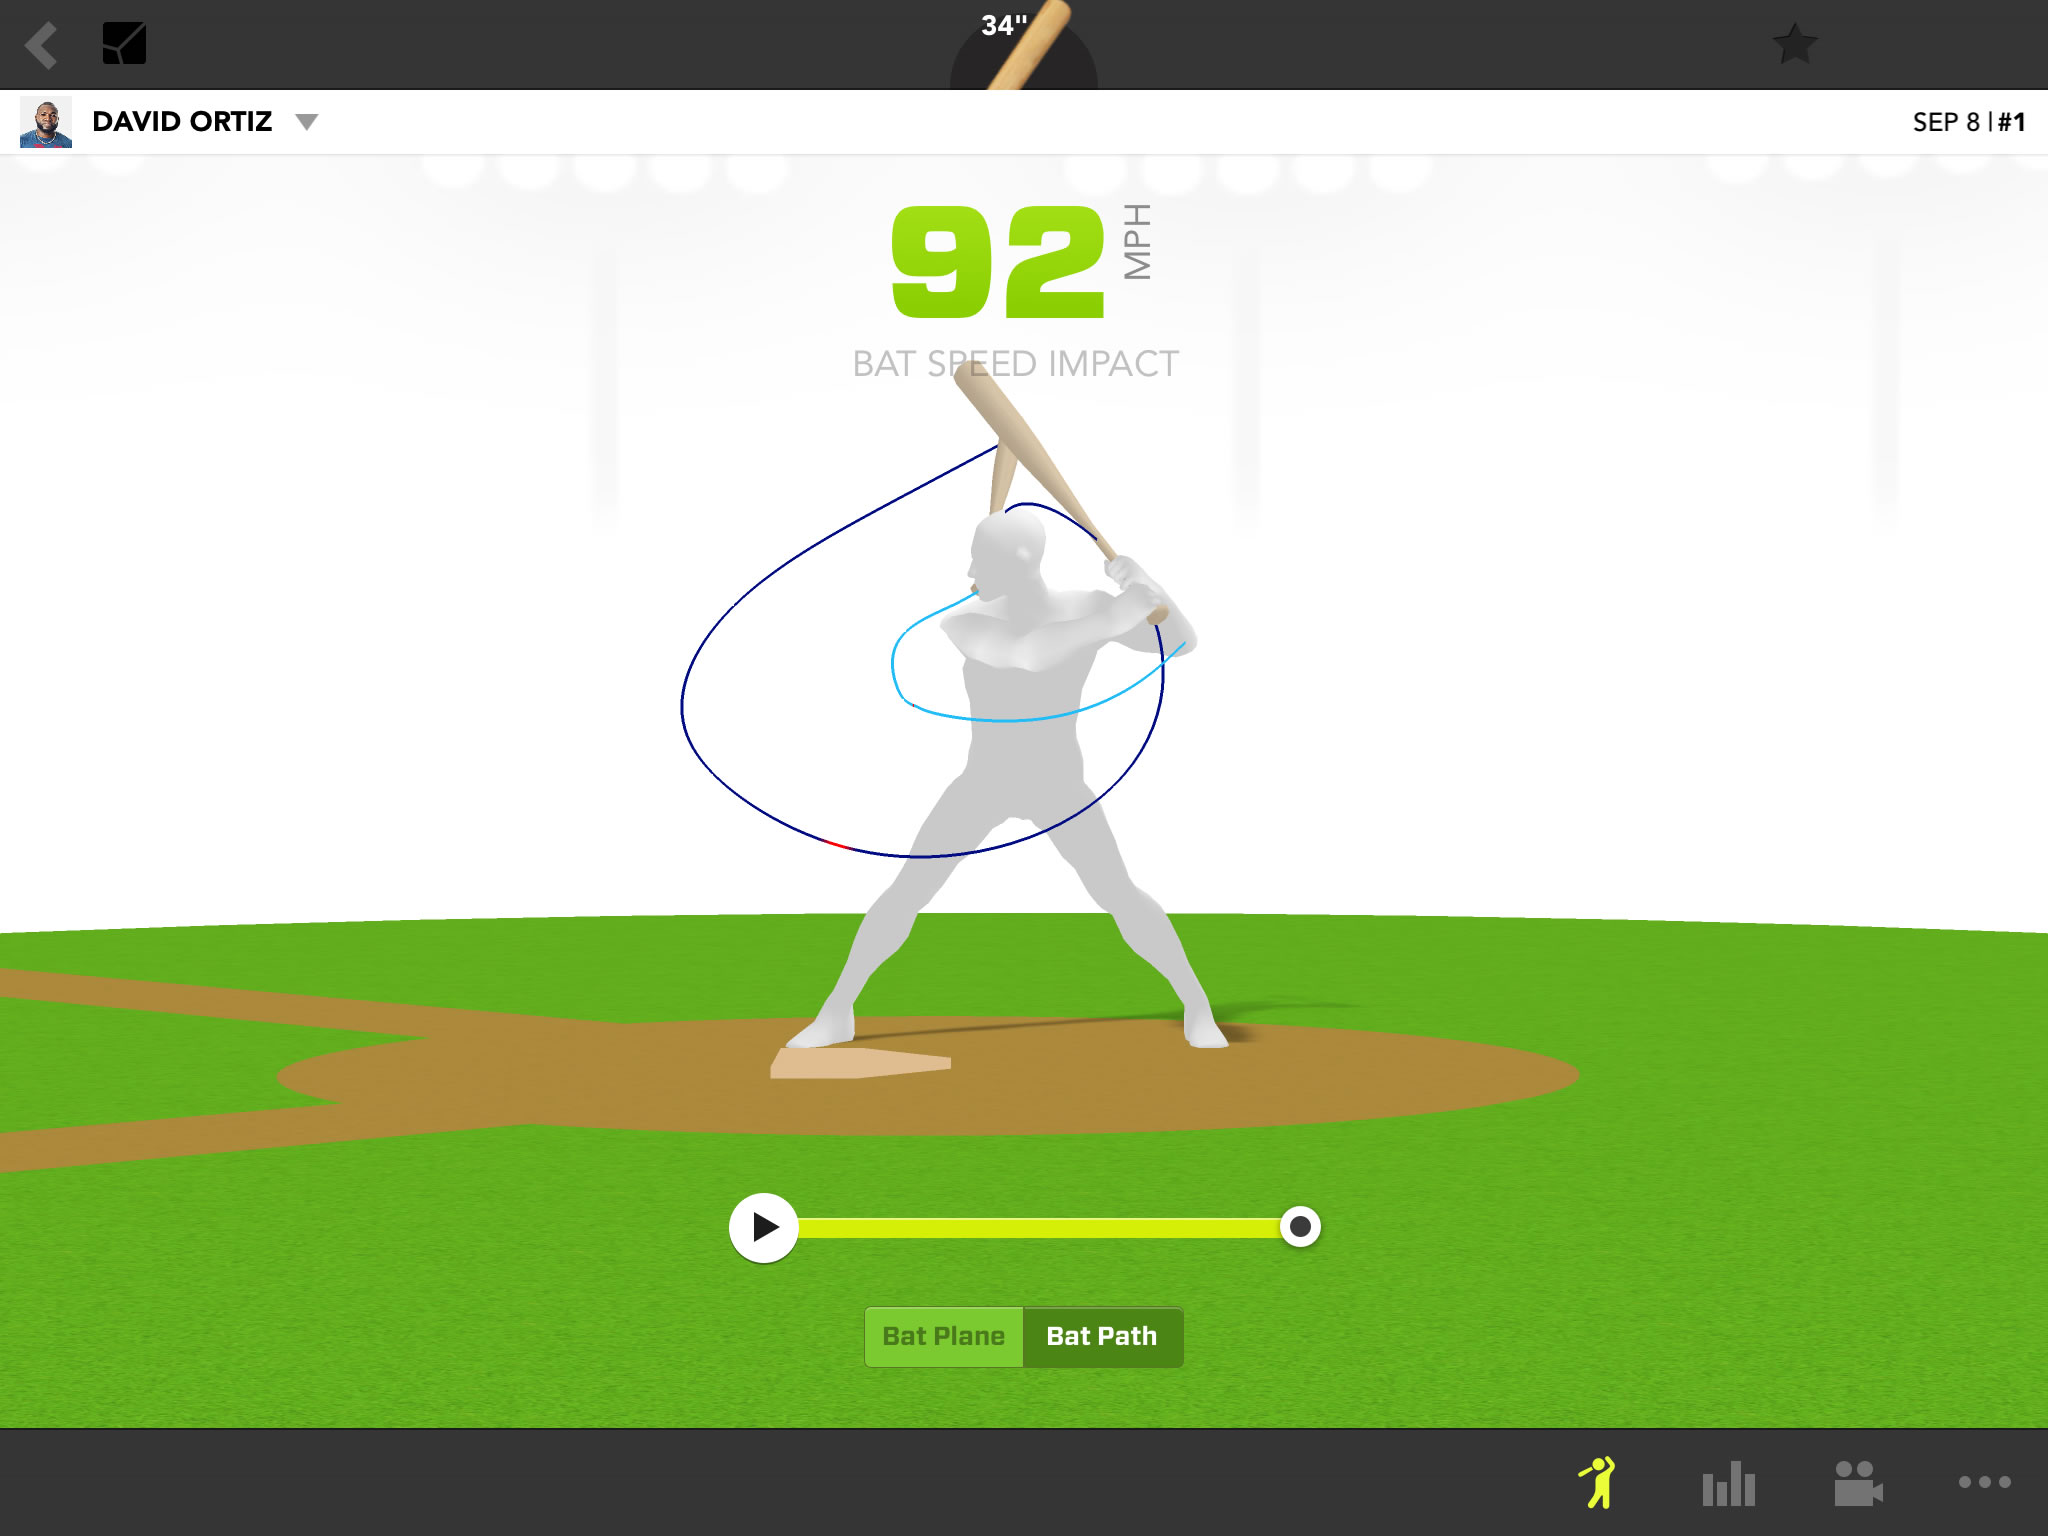
We can glean some extra insights from Ortiz’s relationship with Zepp’s baseball sensor. Because Ortiz is one of nine MLB players who endorse the Zepp baseball sensor, Zepp includes data and video from a couple of his swings with their app. And even when compared to the other professionals they’ve worked with, Ortiz’s swing impresses the Zepp scientists.

“Most of the athletes we work with are 25 years old, in the prime of their career,” Trevor Stocking, Zepp’s product manager for baseball and softball, said. “For him to have the kind of bat speed he does at age 38, 39, 40, it’s really special.”

David Ortiz Data - Total

Looking at his swing data (pictured above), we see Ortiz’s swing speed is in line with other Zepp athletes like Giancarlo Stanton, Mike Trout, and Hunter Pence. Ortiz’s time to impact (how early before contact the hitter starts his swing) is just above league-average. According to Zepp, most professional hitters’ time to impact is between .14 and .18 seconds; Ortiz was clocked at .138 seconds.

David Ortiz Bat Speed Impact

Viewing his swing path in the three-dimensional representation above, we see that Ortiz focuses on keeping his hands close to his body, ensuring the bat stays on a direct path to the ball with a minimal amount of wasted energy. This helps keep his bat fast and his swing quick.

But Ortiz is a giant of a man, listed at 6’4″ and 230 pounds. For younger players who use this technology to compare their swings to that of their heroes, it might not be a great idea (or even possible) to mimic his strategy without his strength. But Stocking says there are still lessons to be learned from his data.

“What you come away with each time you work with David Ortiz is a respect for how hard he works,” Stocking said. “He understands his swing and has a plan when he gets in the batter’s box. That’s something we can all strive to do.”

Apart from Ortiz’s successes, Zepp has had a few accomplishments of their own this summer. The company inked deals with the Angels, Diamondbacks, Padres, and Rays to provide sensors and data to hitters throughout those organizations. CEO Jason Fass said the four teams are additions to Zepp’s existing stable of MLB organizations, but declined to divulge how many or which teams, citing non-disclosure agreements.

Zepp also strengthened their existing relationship with Perfect Game, providing sensors for in-game use at this summer’s showcase events like the PG All-American Classic. The in-game data from such high-level talent provided a novel database for Zepp’s research.

“It’s the first time ever this kind of data has been recorded with pro-level talent,” Stocking said.

The Perfect Game data also hinted at a relationship between attack angle (or swing plane) and success. In the admittedly small sample gathered at the showcase, the average hit was associated with a slight uppercut, an attack angle of 12 degrees. Most outs, on the other hand, were produced by a nearly flat or slightly downward swing, having an average attack angle of -2 degrees.

“This would back up a lot of our MLB data that tells us most line drives occur when the attack angle is between five and 20 degrees,” Stocking said.

The Zepp sensor is a square, neon green device held in place by a flexible strap that goes over the knob of the bat. The sensor contains two accelerometers and one gyroscope, allowing Zepp to track the bat’s path through six degrees of freedom. Having two accelerometers allows the sensor to track the large, high-frequency accelerations that happen around impact while still accurately tracking the lower-frequency accelerations as the bat moves through the zone. The sensor connects via Bluetooth to an Android or iOS phone or tablet, where swing data (and simultaneous video) can be captured, stored, and compared to friends and professionals like Ortiz, Stanton, Trout, and others.


Kinduct Sports Offering Featured in Dodgers Accelerator Program

Kinduct Technologies made waves in the sports tech world when they were selected as one of ten companies in the Dodgers Accelerator program. But CEO Travis McDonough admits that his company is more mature than many of his fellow participants.

“We have 40 employees, we’ve got many many different clients, we’re across different industries, we have a mature operating system,” he said. “We have now 50 professional sporting organizations that are using our tool and it changes every day.”

The tool, which is known as the Athlete Management System, aggregates data from wearable, camera-based, and even more subjective systems into a single environment. The system includes visualization tools so teams can search for correlations between the data themselves, and a machine learning component to further guide organization training plans. The system gives vital help to organizations trying to understand the massive amounts of data they collect from games and practices.

“There’s been an explosion of ancillary tracking tools on the market today, everything from camera systems to GPS trackers to heart rate monitors to smart phones,” McDonough said. “And all those data sources, as valuable as they are, reside in siloed pockets.”

In addition to the Athlete Management System, Kinduct offers similar services in the health care, wellness, and human performance market (which covers military and law enforcement applications). Their experience in these other fields informs the algorithms behind their athletic products.

“Because we have had the opportunity to start to figure the machine learning side out on the health side, we’re able to cross-pollinate and apply it to the sports market,” McDonough said.

But the operating system and machine learning tools are only as effective as the data they can handle. McDonough said Kinduct works with their clients to incorporate both new and existing sources of data. Their web page lists relationships with camera-based systems including the NBA’s SportVu system, as well as wearable trackers like Polar Global and Catapult, among others.

“We’re very agnostic, and we love to pull in data from as many sources as possible,” he said. “So we are absolutely delighted at the new technologies that are coming out, and all these emerging data sources are exactly what make us more powerful.”

Kinduct counts dozens of sports organizations among its clients — including “more than half the NBA,” according to McDonough — and is working with a few unnamed leagues to manage data across all teams. The obvious differences are there, of course: basketball teams have different expectations for their relationship with Kinduct than hockey teams or baseball clubs. But the varying levels of sophistication across organizations provides an additional challenge, and Kinduct has to ramp up or scale back their offerings according to the client’s experience and comfort level.

“The NBA teams, they put their arms right around technology so we adopt what they use,” McDonough said. “When it comes to other organizations … they’re looking for recommendations by us to suggest ancillary technologies that can do the best job of tracking their players.

From a researcher’s perspective, the fact that Kinduct works with such a large percentage of the NBA is exciting. Deep in their databases is tracking and data, across games and practices, on dozens of elite athletes. McDonough estimated that the average NBA team spent $10 million on players sidelined with “preventable” injuries, repetitive stress injuries arising from flawed biomechanics that he likened to a stone cutter chipping away at a rock. And while McDonough was more than happy to describe how an individual team could combine their various data sources to find potential injury markers, he also stressed his company’s respect for the “firewall” that protects not only each team’s raw data, but also any metrics they build on top to analyze those data.

“It’s almost like we provide a technological apartment building, but each and every team moves their specific furniture and wallpaper in it, and the keys to the front door are locked down so no one can go in it but that organization,” he said.

Still, he agreed that a league-wide approach would be more effective, allowing coaches and staff to spot trends in a wider sample of data that could keep players off the trainer’s table.

“The right thing in the future is for leagues to be able to analyze the data and intervene to make sure the players are playing at their best and reducing injury as best as they can,” McDonough said.

Nevertheless, Kinduct is still dealing with health care data, which is subject to a wide range of safeguards to protect patient confidentiality. On top of that, athletes and the players associations that represent them remain leery about biomechanical data being used against them during contract negotiations. Players associations also objected to earlier iterations of the system that tracked athlete workouts during the off-season as excessive. As a result, Kinduct has worked to produce a system that provides the data front offices are after while remaining as unobtrusive as possible to players.

“For a player, they just want to win games, they want to win a championship,” McDonough said. “And a level of surveillance [during the season] seems to be acceptable by both the players’ association, the players, and of course management and ownership.”

It was announced in August that Kinduct was one of the ten companies selected for the Dodgers’ first annual accelerator program, which will run through a “demo day” November 15. The Dodgers are running the accelerator in conjunction with advertising agency R/GA, who has successfully run a number of similar programs in the past. Described by McDonough as “almost like a business boot camp,” the program offers Kinduct mentoring from a who’s who of sports executives and a chance to get more exposure.

“What we have is a Ferrari in a garage,” he said. “This allows us to open the garage door and have more people see our Ferrari. And people want to drive it, and it’s exciting.”

For now, McDonough and his staff have moved to Los Angeles to participate in the accelerator, and plan to open an office in the U.S. after the program to expand into the American market, especially in the health care, fitness, and military areas that fall under the same “human performance” umbrella as the company’s Athlete Management System. Still, McDonough said the company would remain true to its Canadian roots regardless of its excursions south of the border.

“We’ll always have a home base in Halifax,” McDonough said. “But we need to have a bigger presence in the United States.”


Blast Motion, Easton Collaborate to Produce Easton Power Sensor

The Easton Power Sensor, produced through the partnership between wearable sensor manufacturer Blast Motion and baseball equipment manufacturer Easton, was recently released. The sensor was the result of a collaboration first announced in January 2014, and has been in the works since before the official launch of the Blast Baseball Replay.

The product, which will go on the market this fall, is largely a re-branding of the existing Blast Baseball Replay sensor. For the first time, however, Blast will expand its offerings to support Android devices. Donovan Prostrollo, Blast Motion’s senior director of marketing, says that current users will also benefit from future software changes that will come out of this partnership.

“There has been a lot of infrastructure work that has gone on behind the scenes,” Prostrollo said. “We will be providing a free software upgrade to Blast Baseball Replay customers, allowing them to gain all the benefits of the Easton Power Sensor and the new features that are on the way.”

Now that the sensor has been officially released, Easton plans to incorporate it into its traveling Hit Lab, which combines video capture and Trackman radar systems to help players learn more about their swings.

“[The Hit Lab] offers an unmatched opportunity for players to experience the science of hitting,” said Henry Fitzgerald, a member of Easton’s performance sports group. “The Easton Power Sensor will have a central role in this.”

Plans to further improve sensor performance are currently being discussed, but Fitzgerald was understandably reluctant to divulge specific improvements.

“Our R&D department is always searching for ways to improve our bats and any relevant technology,” Fitzgerald said.

The announcement coincided with the start of the 2015 Little League World Series, which ended this past Sunday. As the official equipment sponsor of the event, Easton brought the Power Sensor to Williamsport (shown above) to demonstrate its capabilities for the second straight year.

“It’s exciting to see the kids when they get their hands on the sensor and see their metrics,” Prostrollo said. “By combining the science of hitting with innovative technology, we’re able to give players of all ages and skill levels the insights they need to improve their swing.”

Like Major League Baseball, Little League Baseball currently does not allow wearable senors like the Easton Power Sensor on the field during competitions. But Fitzpatrick says Easton has been lobbying for these groups to lift this ban.

“The sensor as it is today does not offer any sort of performance advantage,” he said. “It’s simply an attachment.”

Like the Blast Baseball Replay, the Easton Power sensor is driven by a “tactical-grade” inertial measurement unit (IMU), which combines more precise sensors, more processing power, and on-the-fly calibration to improves the device’s accuracy and consistency. Both the Blast and Easton apps revolve around video, typically captured by setting the device on a tripod and automatically clipped so that only the events of interest are included. Users can view their swings in adaptive slow-motion, which automatically adjusts the playback speed around key moments in the swing. In an earlier interview, Prostrollo said Blast Motion’s focus on video allows Blast’s Baseball Replay — now re-branded as the Easton Power Sensor — to give users insights into more than just bat path alone.

“Because we approached it from the natural motion capture side, we knew that it was going to be a lot more about what is your entire body doing,” Prostrollo said. “The metrics are really only half the story. You really need to put that in context, you need to make it personal.”


How To Use R For Sports Stats, Part 3: Projections

In this series, we’ve walked through how exactly you can use R for statistical analysis, from the absolute basics of R coding (in part 1) to visualizing data and correlation tests (in part 2).

Since you’re reading this on TechGraphs, though, you might be interested in statistical projections, so that’s how we’ll wrap this up. If you’re just joining us, feel free to follow along, though looking through parts 1 and 2 first might help everything make more sense.

In this post, we’ll use R to create and test a few different projection systems, focusing on a bare-bones Marcel and a multiple linear regression model for predicting home runs. I’ve said a couple times before that we’re just scratching the surface of what you can do — but this is especially true in this case, since people write graduate theses on the sort of stuff we’re exploring here. At the end, though, I’ll point you to some places where you can learn more about both baseball projections and R programming.

Baseline

Let’s get everything set up. We’ll have to start by abandoning –well, modifying– that test data set that served us so well in Parts 1/2; we’ll add another two years of data (2011-14), trim out some unnecessary stats, and add a few which might prove useful later on. It’s probably easiest just to download this file.

Then we’ll load it:

fouryr = read.csv("FG1114.csv")

convert some of the percentage stats to decimal numbers:

fouryr$FB. = as.numeric(sub("%","",fouryr$FB.))/100
fouryr$K. = as.numeric(sub("%","",fouryr$K.))/100
fouryr$Hard. = as.numeric(sub("%","",fouryr$Hard.))/100
fouryr$Pull. = as.numeric(sub("%","",fouryr$Pull.))/100
fouryr$Cent. = as.numeric(sub("%","",fouryr$Cent.))/100
fouryr$Oppo. = as.numeric(sub("%","",fouryr$Oppo.))/100

and create subsets for each individual year.

yr11 = subset(fouryr, Season == "2011")
colnames(yr11) = c("2011", "Name", "Team11", "G11", "PA11", "HR11", "R11", "RBI11", "SB11", "BB11", "K11", "ISO11", "BABIP11", "AVG11", "OBP11", "SLG11", "WAR11", "FB11", "Hard11", "Pull11", "Cent11", "Oppo11", "playerid11")
yr12 = subset(fouryr, Season == "2012")
colnames(yr12) = c("2012", "Name", "Team12", "G12", "PA12", "HR12", "R12", "RBI12", "SB12", "BB12", "K12", "ISO12", "BABIP12", "AVG12", "OBP12", "SLG12", "WAR12", "FB12", "Hard12", "Pull12", "Cent12", "Oppo12", "playerid12")
yr13 = subset(fouryr, Season == "2013")
colnames(yr13) = c("2013", "Name", "Team13", "G13", "PA13", "HR13", "R13", "RBI13", "SB13", "BB13", "K13", "ISO13", "BABIP13", "AVG13", "OBP13", "SLG13", "WAR13", "FB13", "Hard13", "Pull13", "Cent13", "Oppo13", "playerid13")
yr14 = subset(fouryr, Season == "2014")
colnames(yr14) = c("2014", "Name", "Team14", "G14", "PA14", "HR14", "R14", "RBI14", "SB14", "BB14", "K14", "ISO14", "BABIP14", "AVG14", "OBP14", "SLG14", "WAR14", "FB14", "Hard14", "Pull14", "Cent14", "Oppo14", "playerid14")

(We’re renaming the columns for each subset because the merge() function has some problems if you try to merge too many sets with the same names. If you want to explore the less hacked-together way of reassembling data frames in R, take a look at the dplyr package.)

Anyway, we’ll merge these all back into one set:

set = merge(yr11, yr12, by = "Name")
set = merge(set, yr13, by = "Name")
set = merge(set, yr14, by = "Name")

Still with me? Good. Thanks for your patience. Let’s start testing projections.

Specifically, we’re going to see how well we can use the 2011-2013 data to predict the 2014 data. For simplicity’s sake, we’ll focus mostly on a single stat: the home run. It’s nice to test with–it’s a 5×5 stat, it has a decent amount of variation, it gives us experience with testing counting stats while being more player-controlled than R/RBI… and, come on, we all dig the long ball.

Now when you’re testing your model, it’s nice to have a baseline–a sense of the absolute worst that a reasonable model could do. For our baseline, we’ll use previous-year stats: we’ll project that a player’s 2013 HR count will be exactly what they hit in 2014.

To test how well this works, we’ll follow this THT post and use the mean absolute error–the average number of HRs that the model is off by per player. So if a system projects two players to each hit 10 homers, but one hits zero and the other hits 20, the MAE would be 10.

(If you end up doing more projection work yourself, you may want to try a more fine-tuned metric like r² or RMSE, but I like MAE for a basic overview because the value is directly measurable to the stat you’re examining.)

To find the mean absolute error, take the absolute value of the difference between the projected and actual stats, sum it up for every player, then divide by the number of players you’re projecting:

sum(abs(set$HR13 - set$HR14))/length(set$HR14)
> [1] 6.423729

So the worst projection system possible should be able to beat an average error of about six and a half homers per player.

Marcel, Marcel

Now let’s try a slightly-less-than-absolute-worst model.

Marcel is the gold standard of bare-bones baseball projections. At its core, Marcel predicts a player’s stats using the last 3 years of MLB data. The previous year (Year X) gets a weight of 5, the year before (X-1) gets a weight of 4, and X-2 gets a weight of 3. As originally created, Marcel also includes an adjustment for regression to the mean and an age factor, but we’ll set aside such fancies for this demonstration.

To find Marcel’s prediction, we’ll create a new column in our dataset weighing the last 3 years of HRs. Since our weights are 5 + 4 + 3 = 12, we’ll take 5/12 from the 2013 data, 4/12 from the 2012 data, and 3/12 from the 2011 data. Then we’ll round it to the nearest integer.

set$marHR = (set$HR13 * 5/12) + (set$HR12 * 4/12) + (set$HR11 * 3/12)
set$marHR = round(set$marHR,0)

Voila! Your first (real) projections. How do they perform?

sum(abs(set$marHR - set$HR14))/length(set$HR14)
> [1] 5.995763

Better by nearly half a home run. Not bad for two minutes’ work. 6 HR per player still seems like a lot, though, so let’s take a closer look at the discrepancies. We’ll create another column with the (absolute) difference between each player’s projected 2014 HRs and actual 2014 HRs, then plot a histogram displaying these differences.

set$mardiff = abs(set$marHR-set$HR14)
hist(set$mardiff, breaks=30, col="red")
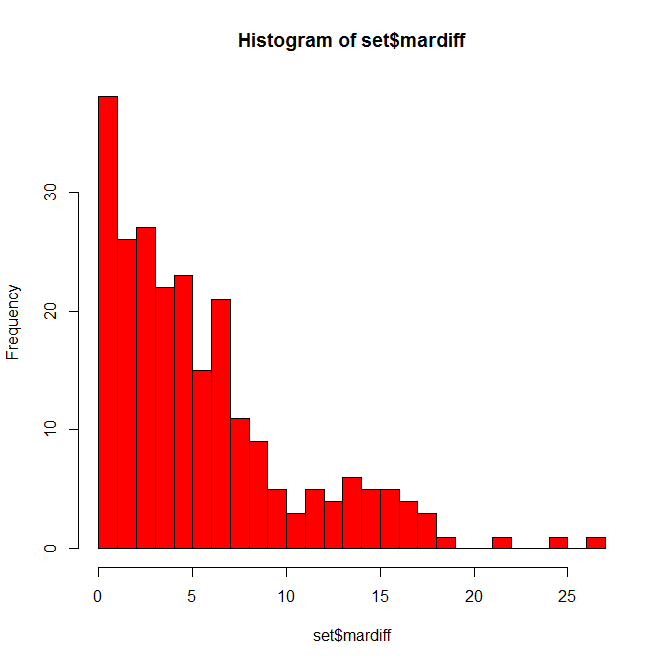
Histogram of Marcel HR errors

Not as bad as you might have thought. Many players are only off by a few home runs, some off by 10+, and a few fun outliers hanging out at 20+. Who might those be?

set = set[order(-set$mardiff),]
head(set[c(1,72,90,91)], n=10)

(In that last line, we’re calling specific column names so we don’t have to search through 100 columns for the data we want when we display this. You can find the appropriate numbers using colnames(set).)
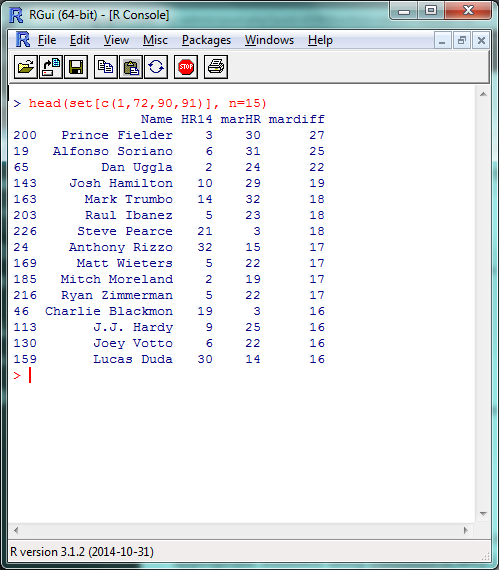
List of players with largest Marcel HR errors

A list headlined by a season-ending injury and two players released by their teams in July; fairly tough to predict in advance, IMO.

While we’re here, let’s go ahead and create Marcel projections for the other 5×5 batting stats:

set$marAVG = (set$AVG13 * 5/12) + (set$AVG12 * 4/12) + (set$AVG11 * 3/12)
set$marAVG = round(set$marAVG,3)
set$marR = (set$R13 * 5/12) + (set$R12 * 4/12) + (set$R11 * 3/12)
set$marR = round(set$marR,0)
set$marRBI = (set$RBI13 * 5/12) + (set$RBI12 * 4/12) + (set$RBI11 * 3/12)
set$marRBI = round(set$marRBI,0)
set$marSB = (set$SB13 * 5/12) + (set$SB12 * 4/12) + (set$SB11 * 3/12)
set$marSB = round(set$marSB,0)

And, for good measure, save it all in an external file. We’ll create a new data frame from the data we just created, rename the columns to look nicer, and write the file itself.

marcel = data.frame(set$Name, set$marHR, set$marR, set$marRBI, set$marSB, set$marAVG)
colnames(marcel) = c("Name", "HR", "R", "RBI", "SB", "AVG")
write.csv(marcel, "marcel.csv")

Before we move on, I want to quickly cover one more R skill: creating your own functions. We’re going to be using that absolute mean error command a couple more times, so let’s create a function to make writing it a bit easier.

modtest = function(stat){
 ame = sum(abs(stat - set$HR14))/length(set$HR14)
 return(ame)
}

The ‘stat’ inside function(stat) is the argument you’ll be including in the function (here, the column of projected data we’re testing); the ‘stat’ shows up inside the bracketed text where your projected data did when we originally used this command. The return() is what your function outputs to you. Let’s make sure it works by double-checking our Marcel HR projection:

modtest(set$marHR)
> [1] 5.995763

Now we can just use modtest() to find the absolute mean error. Functions can be as long or as short as you’d like, and are incredibly helpful if you’re using a certain set of commands repeatedly or doing any sort of advanced programming.

Hold The Line

With Marcel, we used three factors–HR counts from 2013, 2012, and 2011–with simple weights of 5, 4, and 3. For our last projection model, let’s take this same idea, but fine-tune the weights and look at some other stats which might help us project home runs. This, basically, is multiple linear regression. I’m going to handwave over a lot of the theory behind regressions, but Bradley’s how-to from last week does a fantastic job of going through the details.

Remember back in part 2, when we were looking at correlation tests in r² and we mentioned how we were basically modeling a y = mx + b equation? That’s basically what we did with Marcel just now, where ‘y’ was our projected HR count and we had three different mx values, one each for the 2013, 2012 and 2011 HR counts. (In this example, ‘b’, the intercept, is 0.)

So we can then use the same lm() function we did last time to model the different factors that can predict home run counts. We’ll give R the data and the factors we want it to use, and it’ll tell us how to best combine them to most accurately model the data. We can’t model the 2014 data directly in this example–since we’re testing our model against it, it’d be cheating to use it ‘in advance’–but we can model the 2013 HR data, then use that model to predict 2014 HR counts.

This is where things start to get more subjective, but let’s start by creating a model using the last two years (2013/2012) of HR data, plus the last year (2012) of ISO, Hard%, and Pull%. In the lm() function, the data we’re attempting to model will be on the left, separated by a ‘~’; the factors we’re including will be on the right, separated by plus signs.

hrmodel = lm(set$HR13 ~ set$HR12 + set$HR11 + set$Hard12 + set$Pull12 + set$ISO12)
summary(hrmodel)
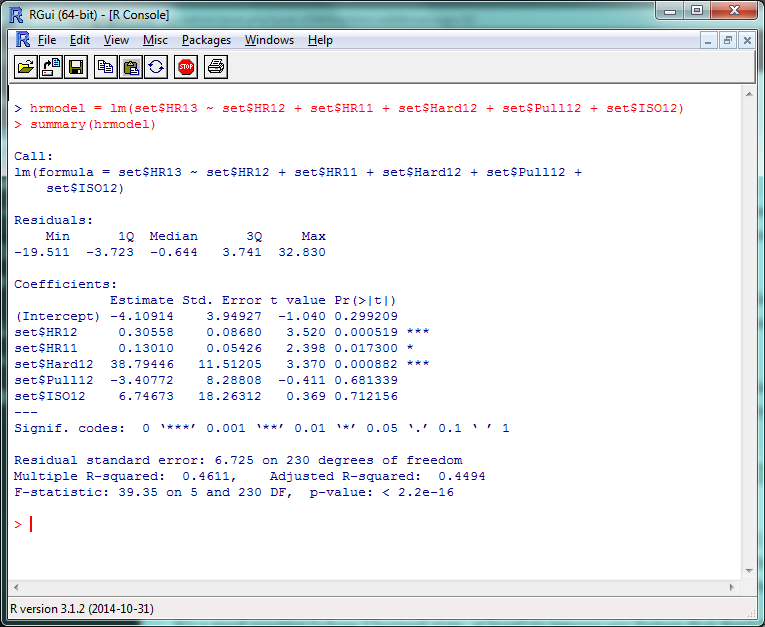
Screenshot of initial linear model

There’s a lot of stuff to unpack here, but the first things to check out are those “Pr(>|t|)” values in the right corner. Very simply, a p-value less than .05 there means that that factor is significantly improving your model. (The r² for this model, btw, is .4611, so this is accounting for roughly 46% of the 2013 HR variance.) So basically, ISO and Pull% don’t seem to add much value to this model, but Hard% does.

It’s generally a good practice to remove any factors that don’t have a significant effect and re-run your model, so let’s do that:

hrmodel = lm(set$HR13 ~ set$HR12 + set$HR11 + set$Hard12)
summary(hrmodel)
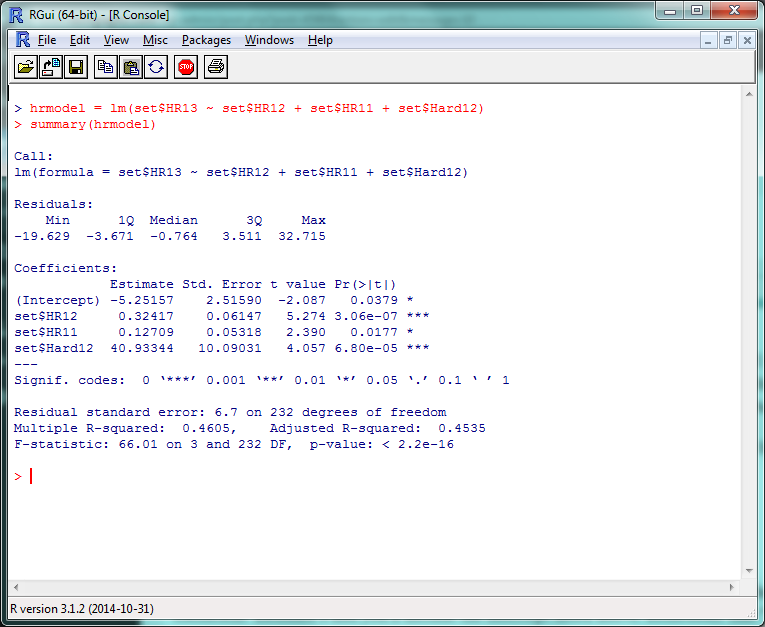
Screenshot of R model with significant factors

And there’s your multiple linear regression model. The format for the actual projection formula is basically the same as what we did for Marcel, except your weights will take the coefficient estimates and you’ll include the intercept listed above them. Remember that “HR12”, “HR11”, etc., are standing in for “last year’s HR total”, “the year before that’s HR total”, etc., so make sure to increment the stats by a year to project for 2014.

set$betHR = (-5.3 + (set$HR13 * .32) + (set$HR12 * .13) + (set$Hard13 * 40))
set$betHR = round(set$betHR,0)

Survey says…?

modtest(set$betHR)
> [1] 5.95339

…oh. Yay. So that’s an improvement of, uh…

modtest(set$marHR) - modtest(set$betHR)
> [1] 0.04237288

1/20th of a home run per player. Isn’t this fun? Some reasons why we might not have seen the improvement we expected:

  • We probably overfit the data. Since we ran the model on 2013 data, it probably did really well on 2013 data, but not as great on 2014. If we check the model on the 2013 data:
set$fakeHR = (-5.3 + (set$HR12 * .33) + (set$HR11 * .13) + (set$Hard12 * 40))
set$fakeHR = round(set$fakeHR,0)
sum(abs(set$fakeHR - set$HR13))/length(set$HR13)
> [1] 4.877119

It runs pretty well.

  • We didn’t include useful factors we could have. We just tested a few obvious ones; maybe looking at Cent% or Oppo% would be more helpful than Pull%? (They aren’t, just so you know.) More abstract factors like age, ballpark, etc., would obviously help–but including these would also require a stronger model.
  • Finally, projections are hard. Even if you have an incredibly customized set of projections, you’re going to miss some stuff. Take a system like Steamer, one of the most accurate freely-available projection tools around. How did their 2014 preseason projections stack up?
steamer = read.csv("steamer.csv")
steamcomp = merge(yr14, steamer, by = "playerid14")
steamcomp$HR = as.numeric(paste(steamcomp$HR))
steamcomp$HR = round(steamcomp$HR, 0)
steamcomp$HR[is.na(steamcomp$HR)] = 0
sum(abs(steamcomp$HR - steamcomp$HR14))/length(steamcomp$HR14)
> [1] 4.892157

That said, the lesson you should not take away from this is “oh, our homemade model is only 1 HR/player worse than Steamer!” Our data set is looking at players for whom we have several seasons’ worth of data —   the easiest players to project. If we had to create a full-blown projection system including players recovering from injury, rookies, etc., we’d look even worse.

If anything, this hopefully shows how much work the Silvers, Szymborskis, and Crosses of the world have put in to making projections better for us all. Here’s the script with everything we covered.

This Is Where I Leave You

Well, that about wraps it up. There’s plenty, plenty more to learn, of course, but at this point you’ll do well to just experiment a little, do some Googling, and see where you want to go from here.

If you want to learn more about R coding, say, or predictive modeling, I’d definitely recommend picking up a book or trying an online class through somewhere like MIT OpenCourseWare or Coursera. (By the end of which, most likely, you’ll be way beyond anything I could teach you.) If there’s anything particular about R you’d still like to see covered, though, let me know and I’ll see if I can do a writeup in the future.

Thanks to everyone who’s joined us for this series — the kudos I’ve read here and elsewhere have been overwhelming — and thanks again to Jim Hohmann for being my perpetual beta tester/guinea pig. Have fun!