Archive for Baseball

Using PivotTables for Fantasy Sports Data

The PivotTable can be — in the right hands — one of the most powerful and useful tools available to an Excel Wizard. What does a PivotTable do? It reorganizes raw data into malleable tables. This allows us to look at the same data, but through a different lens.

It’s kind of like the difference between a cup of cold froyo in its original form — with a layer of peanuts, a layer of chocolate- and marshmallow-flavored froyo, and a layer of chocolate syrup — and a cup of froyo stirred and mixed up so that the sauce and nuts and yogurt are more integrated. It’s all the same components, the same flavor, but in one form, you can see them more clearly.

Before we can use a PivotTable, we need a question and a dataset that requires a PivotTable. (Throwing a PivotTable at a random problem will do you nothing.) The typical question I have that requires a PivotTable: Who performed best over the last three seasons?

And the question is more complicated than just “let’s add up data from 2012 through 2014.” I want to weight the years 5-4-3, meaning 2014 — being more recent — is 1.25 time more important than 2013, and 2013 is 1.3 times more important than 2012. This is a common weighting that Tom Tango uses a lot, most notably in his Marcel projections.

So let’s use a PivotTable with my Ottoneu fantasy team’s data so I can best predict my targets for the upcoming year. I’m going to head to my Ottoneu league’s home screen and then browse to the “Sortable Stats” section, but just about everything here can be replicated with the FanGraphs leaderboards and WAR instead of fantasy points.

I’m going to next choose to look at split season from 2012 through 2014:

This will return a single line per player per season.

Then we export the data to a CSV:

We can open the resulting CSV with Excel.

Opening that data, we get a bare bones spreadsheet somewhat like this:

Here's what a spreadsheet looks like.
Here’s what a spreadsheet looks like.

Then in the Insert section on the top ribbon, choose PivotTable:

Insert > PivotTable
Insert > PivotTable

You will then receive a popup window titled “Create PivotTable.” I never use the first section, but will typically leave the second section alone too. Basically, if you want, you can keep the PivotTable in the same sheet/tab, or you can have it create its own new tab. Since PivotTables frequently change shape, I rarely want it anywhere near my raw data because it could accidentally overwrite key stuff.

So hit “OK.”

This will result in something this-ish:

Sometimes the field list will be docked against the side of the spreadsheet. It just depends on what your default or previous settings are.

My original question is: “Who performed the best over the last three years?” That means I want my rows to be each individual player. To do this — and avoid problems like having two players with the same name — I will drag the “playerid” field to the “Row Labels” section:

The "playerid" field as a unique FanGraphs ID for each player. Baseball-Reference, MLBAM, and other all have their own unique naming systems too, and it's important to use those when possible.
The “playerid” field as a unique FanGraphs ID for each player. Baseball-Reference, MLBAM, and other sources have their own unique naming systems too, and it’s important to use those when possible.

You should now have something unhelpful looking like this:

Now the rows are each identified by a player's unique FanGraphs number.
Now the rows are each identified by a player’s unique FanGraphs number.

Now we need to add the column headings (“Season”) and the data we want displayed (“FPTS”). Again, this is just a simple drag and drop operation:

This will rearrange the raw data into a more helpful form.

So we end up with something like this:

Now the fantasy points (FPTS) are displayed by player and divided by year.

This is great! But let’s get those names in there now. Drag the “Name” field into the Row Labels sections, adding it just underneath the “playerid” field. This should result in a real messy display where the names appear under the numbers and have completely unnecessary subtotals.

Head to the “PivotTable Tools” and the tab “Design.” Here, we can rearrange the look and feel of the PivotTable. Under Subtotals, choose “Do Not Show Subtotals.” Under “Report Layout,” click “Show in Tabular Form.”

By removing the subtotals and changing to a tabular layout, we can see the player names neatly lined beside the unique playerid numbers.

Now our data is in good shape. We’ve isolated the position player fantasy points by season, and now we just need to create a formula that will weight recent performances in favor of older stats.

The finished PivotTable should look something like this.

So now, in order to jam in my own little formula, I will copy the data (CTRL+A then CTRL+C) and paste the values into a new tab or spreadsheet (so CTRL+V to paste it, then CTRL then V to paste just the values). Now that I’ve got raw numbers organized the way I want them, I will delete the top row (which does nothing for me) and then format the data as a table:

After massaging this data a little bit, we should be ready to create our fun little formula.

First, I’m going to use the filter buttons to get rid of any players who had blank years. Not only do these guys complicate the following math, but they also invariably do not qualify for my question concerning most fantasy points over the preceding three seasons.

After I filter out the “(Blank)” items in the each year column, I should have something like this:

Note how there are no hitters with missing years.

Then I just create a formula that multiplies each year by the appropriate 5-4-3 weight, adds the results, and then divides that sum by the sum of the weights (12). That formula is specifically this:

=([@2014]*5+[@2013]*4+[@2012]*3)/12

NOTE: These previous two steps could go in either order, really.

Then, for fun, I’ll format the final column to look a little nicer, maybe throw in a conditional formatting here or there, and then I’ve got a nifty little tool for for my first year draft. Of course, if I were using this data for a draft in an old league, I would have filtered down to just Free Agents — either in the Sortable Stats page, or within the PivotTable:

The filter tool can allow me to pick which fantasy team I want to look at. In the case of an old league, I'd want to look at "Free Agents." Obviously though, in a first-year draft, everyone is a Free Agent.
The filter tool can allow me to pick which fantasy team I want to look at. In the case of an old league, I’d want to look at “Free Agents.” Obviously though, in a first-year draft, everyone is a Free Agent.

So, after all that work, I finally get my sweet, delicious prize:

Tasty, tasty data.
Tasty, tasty data.

With a little bit of formula athletics, we can expand this data to look at everyone, even if they have missed a season. This would allow us to allow put rookies and sophomores into the table. But since this is a PivotTable article, I’ll save that for another time.

Happy spreadsheeting!


Previous How To’s:

How to Use Tableau for Baseball Data
How to Use Vlookup for Sports Data

Let me know if there’s something else you’d like a How To on!


Ned Yost’s Baseball Academics App is Hungry For Braaaiiiiiinnnnnssss

Baseball is 90 percent mental, according to Hall of Famer Yogi Berra. It’s the impetus behind Ned Yost’s Baseball Academics mobile app, which Retain Train developed with the help of the Kansas City Royals manager. Of course, as Berra infamously said, the other half is physical. But other apps can deal with that. Baseball Academics is like a zombie – it just wants your brains.

While Yost is the face of the app, Mike Socha — owner of Retain Train — is the medulla oblongata. He operates the most essential functions to make this whole thing work.

“The goal is to get kids thinking,” Socha said. “There are always going to be mental mistakes. We can’t cure that. But we want to get the kids thinking.

Essentially, the app is a quiz for each defensive position to help players learn which base to throw to. Socha described the app’s system, which is geared towards youth, as a perfect intersection between speed and accuracy, through repetition in a flash card format, to commit scenarios to memory.

Yost described the game to The Kansas City Star as a baseball IQ test. It’s a test that Socha hopes the baseball community will use to evaluate players, along with their stats and physical skills. He said he’s working with Perfect Game and Baseball Factory to have them adopt his Baseball Academic Rating (BAR), which is the score a player earns by playing “official games.”

baseballacademics2

Users start out on level one, which simply informs where the runners are, how many outs and what inning the game is in. In each game, the user scans the scenarios and touches the base to throw to. As users advance through the training and official games (trainings are required before playing an official game, which is used to calculate a player’s BAR), they level up. Level two adds the score and eventually your positioning is detailed as well. Socha said the game is currently built to level four, but the plan is to reach level seven. However, I wasn’t able to determine what differences the advancing levels offered.

I played five official games as a shortstop on level one before I lost interest. In between each official game are required training games. I aced the official games, as you can see below, and was left wondering where I stood out among all shortstop BARs. But I can’t locate my BAR, or level up. When I asked Socha about advancing to level two, he said 30 official games with a score of 850 or better is needed to move up. And maybe because I’m not a 7-year-old boy anymore, and therefore the game wasn’t designed for a 30-something trying to prove himself as shortstop that could’ve been,  I’ve lost interest.

baseballacademics

At shortstop on level one, the only real options to throw to are first base or second base. I learned to watch for runners at first, no matter the outs, and throw to second. If no one was on first, always throw to first, because my decision to throw home with a runner at third and less than two outs always resulted in an incorrect answer — likely because I didn’t know the score or if my shortstop was playing back or in at the grass.

I’m interested in the depth of the app as players continue to level up. Socha said there are leader boards and plans for contests. And if I had an ounce of perseverance in me, maybe I’d keep playing to see if I could school all those kid shortstops across the country for top BAR. The app is worthwhile to train baseball players on the fundamentals on where to throw the ball. However, it’d provide a better value if it expanded to include more complex scenarios, such as bunt defense or base running. There are other mental aspects to the game besides where to throw on defense.

The app is free for Android and iOS devices, however the free version only offers training exercises on level one. To jump further in to the experience, a premium membership is required, which costs $10 a month, or $100 for a one year subscription.


The Sports and Fitness Apps We Know Are Coming to Apple Watch

Apple once again took the tech news industry hostage today, as their Spring Forward event promised to bring new insights into a few of their current products as well as the much anticipated Apple Watch. They announced an HBO partnership with the (now cheaper) Apple TV, an incredibly thin new MacBook, and also previewed ResearchKit — a new way for health professionals to crowd source medical research. But the biggest buzz leading up to the event was Apple’s new wearable, and the folks from Cupertino certainly made that a highlight of the presentation. We don’t know all the specifics yet, but sports fans and fitness nerds should have at least a few things to look forward to.

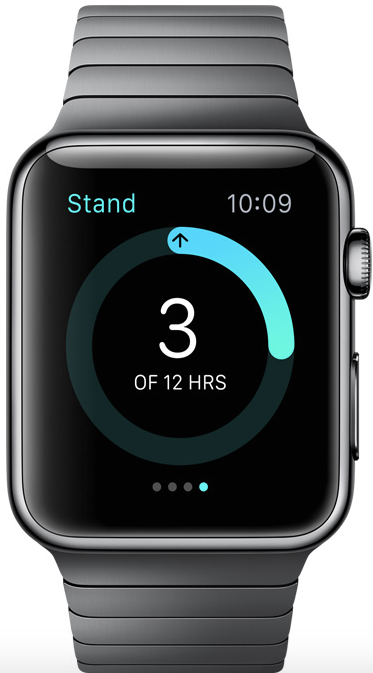
The biggest fitness app really isn’t an app at all, but a built-in feature to the watch. Apple Watch is chock full of fitness and activity tracking options including a workout app, basic step and burned-calorie counters, and will even feature reminders alerting you when it’s time to stand up and walk around a little.

applewatchstand

Third-party apps will also be available for tracking fitness. Offerings from Nike+ Running, Strava, and Runtastic are also being featured on Apple’s web site. Data from Watch will be synced with these services, allowing users more access to and control over their data.

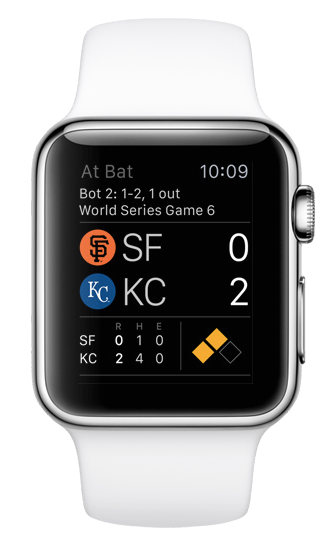
So far, only two apps for sports fans have been announced — MLB At Bat and ESPN. Both will feature team-/game-based notifications and general scoreboard functions, while the At Bat app promises player stats, news, and even highlights. I have to admit, watching highlights on a watch would be pretty cool.

applewatchmlbatbat

Apple has released the iOS update that features the Apple Watch app, but as of this writing access to the Watch App Store was not available. Nevertheless, the Watch API has been out for some time, so it’s easy to assume there will be plenty more offerings above what has been announced today. We’ll keep you updated as soon as we get any more info.

The Apple Watch will be available for preorder on April 10th, with units becoming available on April 24th.


ASMI’s Glenn Fleisig talks about Tommy John Surgeries, Wearable Sensors at Sloan Conference

For such a small piece of tissue, the ulnar collateral ligament can do a lot of damage when it tears. According to Jon Roegele, 90 professional baseball players underwent Tommy John surgery to repair a damaged UCL in the last calendar year, costing teams tens of millions of dollars and months of lost service time. Young prospects, grizzled veterans, pitchers, catchers, outfielders, flamethrowers and junkballers: all went under the knife and emerged with the infamous long, curved scar.

The high stakes go a long way to explain why Glenn Fleisig, Ph.D., research director at the American Sports Medicine Institute, was invited to speak on the epidemic at last weekend’s Sloan Sports Analytics Conference. Fleisig — who also serves as chairman of USA Baseball’s Medical and Safety Committee, an advisor for Little League Baseball, and on Major League Baseball’s Elbow Task Force — presented “Analytics of the Tommy John Injury Epidemic” Saturday morning to discuss the ASMI’s research, dispel some common myths, and talk about the “Pitch Smart” guidelines he helped develop.

Even in the few months since the Pitch Smart guidelines were released, Fleisig said he was “blown away” by the amount of positive feedback he’s received.

“For 20 years, Dr. [James] Andrews and myself have been giving guidelines that have been pretty well received in general by those in medicine,” he said in an interview. “Since the Pitch Smart guidelines came out, we’ve seen the same kind of response from coaches and parents across baseball.”

But Fleisig still devoted a significant amount of time to clearing up misconceptions about the surgery’s success rate (only two-thirds of MLB pitchers who underwent Tommy John surgery made it back to the majors and stayed there) and effect on pitchers (pitchers do not see a bump in performance immediately after the surgery).

The highlight of Fleisig’s talk was a discussion of the risk factors associated with UCL injuries. Fleisig reported the results of a recent study into the biomechanics of 80 minor league pitchers — 40 of whom had returned from Tommy John surgery, and 40 healthy controls. The paper looked at a number of potential risk factors (including amount of arm abduction, stride length, and the infamous “inverted W“), but found no difference between the mechanics of the previously injured and healthy pitchers. Fleisig admitted, however, that the study was not predictive: by looking at the biomechanics of only those pitchers who successfully returned to pitching, the study overlooked any mechanical flaws that had since been corrected, as well as any biomechanical issues in those pitchers who were unable to make a successful comeback.

A better predictor of UCL injuries, Fleisig said, was overuse. A recent ten-year study of 476 adolescent baseball pitchers found that pitchers who threw over 100 innings in a year were three times more likely to be injured; those who regularly threw over 80 pitches in a year more than four times; those who pitched for at least eight consecutive months five times; and those who regularly pitched fatigued 36 times more likely to suffer a UCL injury.

“I hear people say that throwing isn’t a natural motion,” Fleisig said during his presentation. “Throwing is natural. Pitching at max effort, 100 or more times in a game, that’s what’s not natural.”

Fleisig believes overuse of young pitchers is largely responsible for the rise in professional pitchers getting Tommy John surgery, even as organizations are placing increasingly strict limits on prized prospects like Dylan Bundy and Joba Chamberlain.

“A lot of the time, the damage has already been done by the time they get to pro ball,” Fleisig said. “When you pitch, you produce lots of microscopic tears that can heal with rest, but if you pitch too much, then [the UCL] is like a frayed rope, and there’s not much you can do.”

Fleisig’s group has calculated that a 90-mph fastball puts as much as 100 newton meters (N-m) of torque on the elbow. Fortunately, this force is instantaneous or UCLs would be tearing on virtually every pitch. But the ligament still absorbs a significant part of that force; as muscles tire, the amount absorbed by the UCL can increase, leading to the dramatic increase of UCL injuries in pitchers who regularly throw when fatigued. Fleisig said that strength and conditioning can help reduce the risk of injury, but stressed the importance of the entire kinetic chain, from legs to trunk to arm muscles.

“I wish I could say there was one key to avoiding injuries — and that would make a good article — but that’s not reality,” Fleisig said. “The secret isn’t the legs, the secret isn’t the arms, the secret isn’t the trunk, it’s the whole body.”

In addition to his work with ASMI and the sport’s governing bodies, Fleisig also serves as a consultant for Motus Global, a movement analysis company whose mThrow sleeve for pitchers will be available to the public this spring. The headline number produced by the system will be a measurement of workload, derived from the sum of the torque put on the elbow across all throws a player makes, including pitching in game situations, warmups, and drills such as long toss. The sleeve (and the metrics it provides) are still in the early stages, but Fleisig is confident that it represents an improvement in teams’ understanding of workload.

“We don’t know what the right exact formula [for workload] is,” Fleisig said. “For instance, if you throw two throws at 50 N-m, is that the same amount of danger to your elbow as one throw at 100 N-m? Probably not. But before the Motus sleeve, workload was just added up by people counting how many throws someone did.”

Fleisig admits, however, that users will rely too heavily on the system’s workload calculation, especially at the amateur level where coaches, trainers, and players may lack the rapport to establish when a pitcher is truly fatigued.

“The potential customers for the Motus sleeve are not only pro pitchers but also high school kids,” Fleisig said. “I would hope that the pro teams would click through to see the extra data the sleeve produces, whereas I think the summarized information might be the best for many of the amateurs.”

A number of companies aim to improve further on Motus Global’s innovation, and are working on systems that can automatically capture full-body kinematic data without markers. Fleisig does not consult on any of these projects, but has seen some of them in action. Most, including the system Sportvision presented at Saberseminar last summer, require manual digitization, where a human observer annotates the location of the pitcher’s joints at every frame. But despite the demand for automated systems, Fleisig stressed that these technologies are only a tool in the arsenal of coaches, trainers, and pitchers to prevent injuries and improve performance.

“Biomechanics experts and technology are not the keys to optimizing pitcher safety and performance,” he said. “The key will be the expertise of coaches to use this new information.”


Mystery MLB Team That Purchased $500,000 Supercomputer Remains Unknown

ESPN released their “Great Analytics Rankings” last week, placing the Houston Astros second behind the Philadelphia 76ers as the most analytically-minded pro sports organization. In their profile of the Astros, ESPN speculated that the Astros were the mystery MLB team that purchased a Cray supercomputer last year, but the company responded on their blog this week that the team that bought it won more games than the Astros, declining to what team purchased for confidentiality reasons.

Nick Davis, PR manager for Cray, wrote on their blog, “While I’m not going tell you here who the team is, I can tell you that it’s not the Astros. We think it’s great the Astros are ‘all-in’ on analytics according to ESPN, but unfortunately they are not all in with Cray. At least, not yet. I will say this — we applaud the Astros for their adoption of analytics, but the team with a Cray won more games last year.

According to The Economist, 95 percent of all MLB data has been created in the last five years.  With MLB’s award winning Statcast system projected to be installed at all 30 MLB parks, this kind of computing power may become necessity for analytics departments to process mountains of data quickly.

For any sleuths out there trying to find the mystery team, Pete Ungaro, Cray’s CEO, said that the team who purchased the supercomputer is an organisation that five years ago people would not have guessed would want one.

(Image via clockwerks)

MLBAM wins Alpha Award at Sloan Sports Analytics Conference

The biggest media company you’ve never heard of won an Alpha Award for Best Analytics Innovation/Technology at the MIT Sloan Sports Analytics Conference last week for their player tracking system called Statcast.

Statcast was introduced publicly by MLB Advanced Media (MLBAM) during the 2014 season in a limited number of ballparks. At the Sloan Conference, Commissioner Rob Manfred announced that all 30 ballparks will have the Statcast system installed by Opening Day this year.

Statcast uses cameras installed in multiple areas around the park to track player movement throughout the game. As you can see from the videos below, the data Statcast can analyze is staggering, spitting out everything from batted ball and player speed to reaction times and pitcher extension.

Dave Cameron, our esteemed head honcho at FanGraphs, was part of a panel at Sloan this year and also reported on the most interesting parts of the panel Manfred was a part of with MLB Network’s Brian Kenny. In a wide-ranging interview with Kenny, Manfred said that Statcast would provide real time data through the premium version of the MLB At Bat App as well as some data on MLB.com. More importantly, Manfred intimated that the model for Statcast data would eventually resemble the PITCHF/x model, with the data being publicly available instead of hoarded by teams.

With estimated revenues of $800 million on 2014, streaming video deals with WWE and Turner Sports, and Statcast technology available in all 30 ballparks in 2015, MLBAM will soon be a media giant that everyone has heard of.

(Image via Gabriel Argudo Jr)

MLB Looking to Spin Off Advanced Media Division

You may have heard the term MLB Advanced Media (MLBAM) in the past. They are the folks behind MLB.tv as well as the At Bat app and Gameday feeds. But they’ve gotten so good at delivering digital content, that they have branched outside of baseball. MLBAM now helps power the WWE Network, WatchESPN, and MLBAM technology will soon be providing the long-awaited standalone HBO GO service. MLBAM has become so large and powerful that MLB is looking to possibly turn it into its own business.

The idea is to keep the websites and ticketing stuff with MLB, but to fork everything else over to MLBAM. While it’s possibly a surprising move, it shouldn’t be unexpected. MLBAM makes crazy paper for MLB, and it’s only looking to expand. They took a bet on video streaming over ten years ago, and have since built a solid infrastructure around that technology. They are the mechanic that’s been on your block for decades — others might promise more, but MLBAM has been around forever. They know how to make these things work.

And no matter how much content providers whine and moan, more and more TV is going to be shown on things that aren’t TVs. WatchESPN is expanding all the time. HBO GO’s move will soon inspire other top-tier cable networks. We can every Simpsons episode ever made on our phones, for crying out loud. I feel like I’m in one of those news stories from the 90s that’s trying to tell you what the Internet is. You know these things I’m telling you, but they’re important to remember when thinking about what MLBAM is doing. Through some forward thinking, some early investments, and a little bit of luck, a sports league has ended up being a giant in one of the biggest tech industries around. And instead of sitting on their haunches, they’re being proactive about it. And that’s hard for a large company to do. Startups are nimble, easily adaptable. Big companies with lots of human and financial investment can’t navigate as quickly, but MLBAM is trying their best.

They are succeeding at it, too. And only look to get stronger and richer. Now, if they would return Sports on Earth to its former glory, then things would look even sunnier.

(Image via Geoff Livingston)

A Short History of Video Game Baseball: Tornado Baseball

Part 1: The Magnavox Odyssey

Four years have passed since Ralph Baer brought the thrill and excitement of baseball to your television via the Magnavox Odyssey and its three omnipresent white squares. The year is now 1976, and everyone is playing Pong, listening to Afternoon Delight and mourning the deaths of renowned Japanese electrical engineers Hidetsugu Yagi and Shintaro Uda. Magnavox has released two more home consoles, the 100 and 200, but it’s becoming clear that for the latest games, the burgeoning arcade scene is where, proverbially, it’s at.

We have the first ultra-violent video game, Death Race, based on the movie and rewarding players for running over stick-figure “gremlins” with their cars. Atari, with the help of Steve Jobs and Steve Wozniak, release the iconic Breakout. Meanwhile, Midway Games returned to the grand old game, releasing the two-player arcade Tornado Baseball.

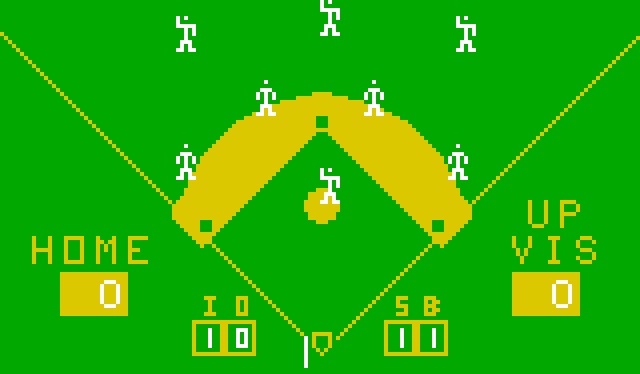
Baseball grew up a lot in those four years. Players are no longer represented by squares, or even one of the more intricate quadrilaterals. Instead they are honest-to-God stick figures with arms and legs and saddle-sore thighs, sometimes locked in rigid half-wave, as though shielding themselves from an unmoving and broiling sun. Also, there are eight of them, the catcher deemed unnecessary for the cause.

Tornado Baseball is still black and white – color arcade games were known by this time, but still expensive and rare – but instead of projecting directly out of a screen, it is cleverly projected upwards onto a mirrored panel that adds grassy green and dirty brown. The game is two-player only still, and certain actions are still automated: runners travel a predestined number of bases per hit, and throws and catches are made by the fielders without waiting for advice from the player. (In the event of a double play, the second out is called before the throw reaches first, in pleasant Frank Drebin-style umpiring). Outfielders, in what will become a common refrain, move with synchronized precision.

Mechanically, Tornado Baseball looks far more like the modern arcade baseball game than the Odyssey’s version: the batter is at the bottom, the fielders spread out above him. I say batter, but we’re not ready for that yet: instead we see a floating bat that swings through the plate at the push of a button. The pitcher selects one of eight different types of pitches and then steers it, in that wonderfully odd Mario-jump way, left and right and slow and fast to deceive the hated bat. After contact, it’s 1972 again: the ball flies off the screen in a given direction, the bat transforms into a runner and gets 0-4 bases depending on where the ball disappears. Quoted from the manual: “The infielders automatically move to make the plays, which adds to the excitement of the game.” Sure.

It’s not a game that aged well. The timing aspect of hitting remains the same as the Odyssey version, but the aiming mechanic on the part of the hitter has been eliminated; now it’s just wait and click. Also, the advanced graphics actually only succeed in underscoring how limited the game is in other aspects. In an interesting bit of flavor, the players run on and off the field between innings, and defenders run to cover bases – the pitcher in particular loves to cover first, even when the first baseman is still standing there – but there’s no animation for throwing a ball, which makes the game look as if it’s being played by little puppets.

Tornado Baseball grew in several directions. On the arcade side, it saw three sequels, each with a new name and a handful of slight improvements. Double Play (1977) added a computer AI but removed four of the eight pitch-types. Extra Inning (1978, not pluralized) restores the lost four pitches and adds a extra-game prize for hitting six letters in the outfield. Extra Bases (1980) finally included a graphical overhaul, including color and rudimentary bleep-blorp sound.

Astrocade

It was also a launch title for the now-forgotten Bally Astrocade, a home console from 1978. The Astrocade sold for a staggering $299 ($1,168.05 in 2014 dollars) and employed advanced technology for its era: the ability to display four of 256 colors onscreen at a time, 4k of RAM, 8k of ROM, and a glorious 160×102 resolution. Compare that to the Atari 2600 (128 colors, 128 bytes RAM, 4k ROM), released in the same year, and you can see why it paid to be rich in the late seventies, as in all other times.

It’s a rare case of the concurrent home port being far superior to the arcade original. Of the Midway baseball family, Tornado Baseball most resembles Extra Bases, released a full three years later. The limited resolution wreaks havoc on the font, and the stick-limbs of the players are a little more stick. It’s perhaps a bit of a disappointment, still feeling more like pachinko than sport. But if you loved baseball enough in 1977 to sink 1,196 quarters into it, the Astrocade was a cost-effective solution.


How and Where to Watch College Baseball Online


Carlos Rodon’s slider simultaneously giveth, taketh away.

Collegiate baseball possesses two compelling qualities even for those who, like the author, don’t have a vested interest in a particular school’s success on the field. For one, it offers the opportunity to consume actual baseball at a time when — like all of February and March, for example — at a time when the professional version of the game remains entirely too obscure. For two, it allows one to watch and become acquainted with no fewer than half the players who’ll be selected in the first round of the amateur draft in June.

White Sox left-hander Carlos Rodon, for example, was ranked eighth among all prospects by Kiley McDaniel this morning at our sister site, FanGraphs. Rodon’s repertoire includes a fastball that sits at 92-95 mph and, more impressively, a slider which, by some unusual property, has demonstrated the capacity to repair the ozone. At this time last year, however — months before he was selected third overall by Chicago — Rodon was throwing those sliders for NC State.

“That sounds excellent, but how does one find his or her way to such a game?” is a reasonable question to ask at this juncture — and one I’d like to answer poorly in what follows.

As a resident of a region in which college baseball isn’t widely available — or, at least, not available at the highest level — I’ve been forced to search for either television broadcasts or streaming video. The former is often more expensive than the latter.

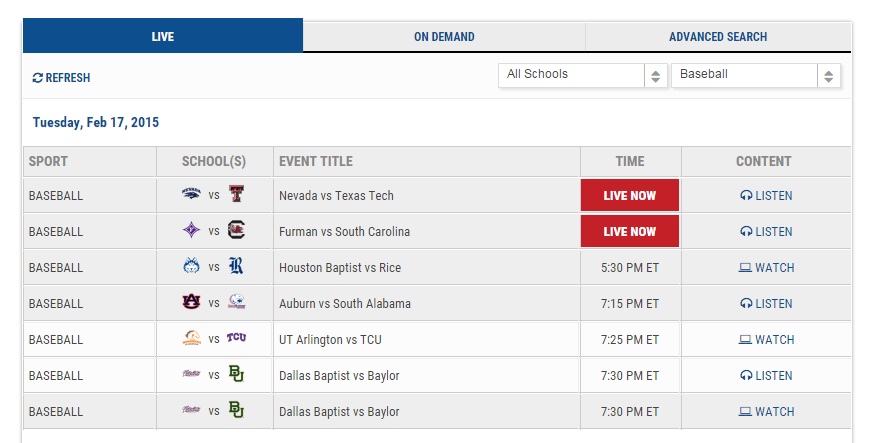
If one’s interest is in having access to the greatest number of games for the least amount of money, CBS’s College Sports Live is the best option. It costs just $9.95 per month and is available as an app, as well, for iPad and iPhone and Android devices. As I documented at NotGraphs a couple years ago, I subscribed to an earlier version of this same service called ULive. College Sports Live features three distinct advantages over ULive: a more intuitive layout, accessibility on other devices, and price (ULive was $14.95 per month).

CSL
College Sports Live offers live games and on-demand replays.

This past weekend, I used College Sports Live to watch two ranked teams (Rice and Texas) play each other — and was also able to see possible first-round selection, Illinois left-hander Tyler Jay, make a start against Lamar University. While the feeds for both those games were reasonably strong in terms of video quality and camera angle, one is also at the mercy of the particular university’s resources so far as that’s concerned. A Virginia game featuring top collegiate pitcher Nathan Kirby was also available, but the main camera was an elevated, behind-the-plate one that lacked intimacy and provided almost no information regarding Kirby’s pitches.

I note in that review of ULive from three years ago that I chose to watch Stanford and Vanderbilt — and, indeed, the latter of those schools features probably the best team in all of college baseball at the moment. So far as I can tell, however, watching Vanderbilt by way of College Sports Live is impossible now, since the introduction of the SEC Network a couple years ago, the product of a partnership between the conference and ESPN.

SEC
WatchESPN’s college baseball content is largely provided by the SEC.

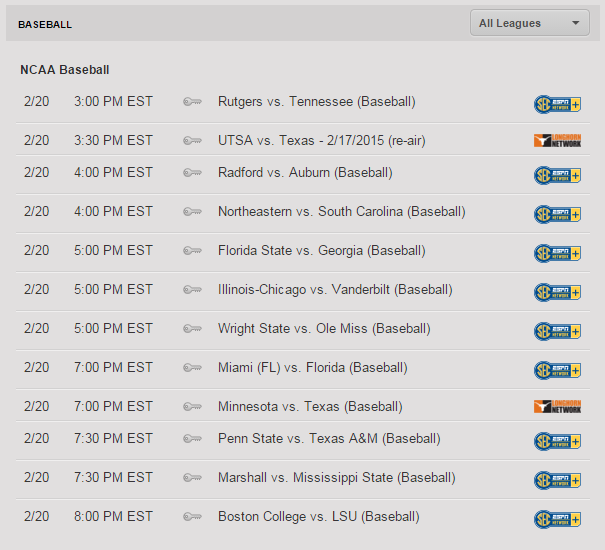
The SEC Network is available by way of most digital cable packages, but seems to require one of the more robust subscription levels from any given provider. To receive the SEC Network at my home would necessitate something called Digital Basic, for example, which costs roughly $95 per month. It does include access via WatchESPN online not only to all the normal programming found on the SEC Network, but also to SEC Network Plus, which offers feeds of games unavailable on the the actual channel. If one really is dedicated to the idea of watching of watching the best college baseball, ignoring the SEC poses some difficulties. Right-hander Walker Buehler, shortstop Dansby Swanson, and other shortstop Alex Bregman, for example, were all featured near the top of Kiley McDaniel’s way-too-early 2015 draft rankings — and all play for SEC schools.

The Stanford-Vanderbilt game would be impossible to watch on College Sports Live in 2015 for another reason: the conference to which the other school belongs also has its own network now. Nor is this unique at this point. In addition to the Pac-12 Network is also the Ivy League and even Southern Conference networks.


MLB, FOX Discuss Removing Blackout Restrictions

Will MLB.TV be blackout free? Say it’s so, Joe. According to Forbes, Major League Baseball and FOX are negotiating a deal that would remove blackouts from any games streamed by FOX regional sports networks. Last year, FOX-owned regional sports networks aired 37 percent of all broadcasted games.

The biggest roadblock to a deal is how this affects FOX. If MLB Advanced Media, the digital arm of the MLB, can offer the games on MLB.TV without blackouts, it’d cut in to the amount of viewers on FOX Sports GO, the network’s streaming service, and on foxsports.com. In 2014, the nationally broadcasted games, including the All-Star Game and World Series, streamed to FOX’s mobile app without blackouts. And while they’d attract viewers that don’t subscribe to MLB.TV, they’d still lose a piece of the pie.

The real news here, though, is that blackouts are finally being addressed. And for that, we have to give thanks to the new commissioner, Rob Manfred. As far as we know, Bud Selig never pushed for a resolution. And while Manfred is at least making a deal with FOX  a priority, he does acknowledge the challenges that television territories carry in order to lift blackouts completely.

“Television territories that cause these blackouts are integral to the economics of the game,” Manfred told Forbes. “They’re a foundation of the very structure of the league. Blackouts are actually caused, not by our desire not to cover that area, but by the inability of the rights holder to get distribution in certain parts of the television territories. It’s not solely our issue to resolve. Having said that I am aware of these complaints and whenever we have an issue like this we are constantly evaluating how we do business to make sure we are as fan friendly as possible.”

MLB_Blackout_Map1000x733
Image via bizofbaseball.com

Maury Brown, the Forbes contributor that broke this story, published a MLB Blackout Map to illustrate the TV territories. “While there has been a thawing of blackouts on the national level,” Brown wrote, “it is local broadcasts that create the most trouble due to territories for each club that started out as over-the-air reach, and ran amok as pay-TV took hold. They are, to the fans, arbitrary, and at the very least, arcane.”

These regional sports networks that run TV territories want to get paid. Ultimatley, this is the problem facing any solution to blackouts. Paul Swydan of FanGraphs dissected this issue brilliantly on Friday, and included his idea of a Super Premium MLB.TV package that would keep the local networks from losing revenue generated by carriage fees (due to lost cable customers) and allow the networks to run their local ads, rather than the MLB.TV ads we get now.

These are complicated issues to work through. But I like I wrote earlier, the real news here is the problem is finally being addressed.

“This reported agreement between MLB and FOX is a nice first step,” Swydan wrote. “Hopefully we’ll see more steps soon.”

Image via Billy Bob Bain