TechGraphs News Roundup: 8/21/2015

My skin is finally starting to recover from the wicked sunburn I got at the PGA Championship last weekend, but my brain is still thinking about what’s going on in the sports-tech world. Here are some stories we here at TechGraphs found interesting this week.

It looks like in-market baseball streaming is coming. Well, sort of. As of now, it only applies to subscribers of Fox Sports regional sports networks. Basically, if you subscribe to Fox Sports [Something] via cable or satellite, you’ll be able to stream a baseball game on your phone if you aren’t near a TV. So, no, an MLB.tv subscription won’t save you from the grips of local blackouts. It is a step in the right direction, but we’re still a ways away from watching your local team on your At Bat app.

FiveThirtyEight did some really interesting work with Pitchf/x data looking at the accuracy of umpires’ balls and strikes calls over time.

Ned Yost won’t be able to look up Pitchf/x data on his Apple Watch, because he still isn’t allowed to have a smartphone in the dugout. But MLB says it’s OK if he wants to wear his expensive timepiece in the dugout.

FanDuel, a daily fantasy sports company, has purchased numberFire, a fantasy sports recommendation site. Mark my words, FanDuel and DraftKings will merge and buy Disney and Google some day.

Engadget has a story about a really cool project involving detecting head trauma in football using special polymers in the helmet. While a motionless player is never a good sign, many players could suffer possible brain damage without having as drastic outward symptoms. Learning the level of force applied to the head just by looking at the helmet could be huge.

World Rugby is also looking to better assess head injuries, as well as enhancing their official review system with a new partnership with Hawk-Eye.

According to the Telegraph, Rugby is also getting in on that sweet, sweet analytics game.

The role of 3D printing has boomed in the world of prosthetics lately, and now it’s helping youngsters throw out first pitches at baseball games. Pretty cool.

Do you want a shirt that tracks your vitals while you work out?! Do you want to pay $300 for it?! If so, then Ralph Lauren has your back, friend.

That’s all for this week. If you need me, I’ll be bathing in aloe. Have a good weekend. Be excellent to each other.


VR’s Sports Invasion is Coming: Part 1

Courtside of the NBA finals sits Phil from Cleveland, draped in a stained bath robe with more holes than Pebble Beach. Football practice for New York Jets quarterback Geno Smith, despite his broken face. A Cincinnati Reds fan dug in against Aroldis Chapman and his impending 102 mile-per-hour heater while wearing shorts, sandals and a faded Senor Frogs tank top from spring break ’98. A college recruiting trip inside the coach’s home, arena and practice facility of a top SEC football program – cheerleaders included. With virtual reality, each of these can be an actuality. Some are already possibilities. And others could happen before the next President is sworn in to office.

If there was one take away from the Consumer Electronics Show in January – other than the realization that the wearable market is almost as saturated as homemade craft shops on Etsy – it’s that virtual reality (VR) is coming. That winter in Game of Thrones is like a snowflake compared to the hyped fallout from the Las Vegas trade show. VR is coming hard, it’s coming fast and it will own our souls. That is, if the reality matches the hype.

Oculus, the most recognizable VR hardware, had a booth for the first time at CES. Articles, blogs and videos of the VR experiences flooded the Internet with tales of the unimaginable, the unfathomable and the just plain cool. Scott Stein of CNET.com called VR the eye-catching showstopper and noted Oculus headsets everywhere. Last month the company announced that the Rift will ship to consumers in the first quarter of 2016. As it builds on the Crescent Bay prototype, which many raved about, and is backed by Facebook following the $2 billion acquisition last year, it will be the Rift pressured with bringing VR in to the homes of the masses.

Today, the post-CES buzz has muffled though the anticipation of consumer VR hasn’t ceased. Now, it’s just a matter of when, not if, early adopters will have consistent, quality content to utilize current and future VR rigs. Sports, along with entertainment and pornography, is a leader in technological innovation. Broadcast companies, video game creators, sports leagues and teams all have chips in the proverbial VR pot as they fight for fan engagement, sales and television ratings. While some are calculating their bets, others are all in.

TechGraphs takes a look at what is out, what is coming and potential challenges that face VR’s invasion of sports. Will it be another 3D television? Or will we all wonder how we lived without it in ten years?

Gaming

While VR initially evokes an image of a video game experience for most, its origins are much different. In Pygmalion’s Spectacles, a science fiction short story published in 1935, author Stanley G. Weinbaum detailed a VR system that used goggles with holographic recording of fictional experiences that included smell and touch. In 1957, Morton Heilig, the “father of virtual reality,” invented the Sensorama, which received a patent in 1962. It used 3D motion picture with smell, stereo sound, seat vibrations and wind to create the VR experience. Heilig, a cinematographer, also created a 3D camera for the project. The evolution of the computer harvested an organic relationship between VR and gaming. A relationship that blossomed in to the gaming indstusry as the leader of VR implemenation. A relationship that, according to mobile internet/VR/games and digital client consultant Digi-Capital, could generate $30 billion by 2020.

Except when it comes to sports games.

In January, video game developer Ghost Machine launched the first VR sports game from Steam, the popular online game distributor. Motorsport Revolution is a physics-based PC racing game compatible with the Oculus Rift DK2 headset. The single-player racing game featured multiple 3D tracks tracks, including famed California Speedway, and an action feel filled with an aggressive AI and fantastic crash scenarios. VR Sports Challenge was announced at E3 to launch with the consumer version of the Oculus Rift. Think of it as a Wii Sports-type title. Google search virtual reality sports games and you’ll find little else.

Screens1920_07

Ghost Machine’s CEO Neal Nellans told me earlier this year that big video game developers will sit on the sidelines with a wait-and-see attitude. Today, it seems the big boys moved from the sidelines to the luxury box to munch on appetizers, sip aged scotch and watch a different game on a massive flat screen, all the while checking in on the VR game on the field below to see if it gets interesting.

Peter Moore, chief operating officer at Electronic Arts, told Gamespot that his company will jump in to the VR marketplace “if and when virtual reality becomes a ‘high-demand’ activity.” Moore wants the gear on the heads of consumers first.

Three months ago Owen Good highlighted challenges that face VR in sports games for Polygon. Ignore the writer’s argument that VR can’t give us the superhuman experience we want in games, and Good starts to make some sense.

What keeps sports out of the virtual reality conversation is the size – or lack thereof – of the market. There is no current sports simulation title available on Wii U. I realize people attribute that to some dark deal Electronic Arts demanded and Nintendo refused, but the fact remains there’s still no NBA 2K no WWE 2K — no Pro Evolution Soccer, for God’s sake — on Wii U either.

These are iterative titles with codebases literally stretching back to the Dreamcast days. If they can’t readily adapt that work to make the Wii U controller’s second screen necessary, or even meaningful, it is going to take an even greater overhaul — if not a complete work from scratch — to create virtual reality edition.

And that’s after all of the league licensing costs — which are a huge brake on innovation, — are figured into the discussion.

For Moore, he sees the hardware, rather than software, as an issue. A year ago Gamespot reported that Moore insinuated that the VR headset is dorky.

“It’s an incredibly immersive experience, but it’s you,” Moore said. “You’re inside this world and you’re oblivious and of course, you can’t see. You hope it doesn’t get what I’ll call the Segway effect: incredible technology that kinda looks dorky. Or the Google Glass effect, which is the dork factor that goes with that.”

But that’s not to say that there aren’t big boys moving forward. Last month, Gaming Respawn reported that Ubisoft, the publisher behind uber popular titles Just Dance, Assassin’s Creed and Rainbow Six, is working on multiple games to launch once Oculus and Playstation’s Project Morpheus reach consumers.

“We are working on the different brands we have to see how we can take advantage of those new possibilities,” CEO Yves Guillemot said during an earning’s call last month, “but making sure also we don’t suffer from what comes with it, which is the difficulty to play a long time with those games. We are very bullish about the potential. We think it is going to bring more players to the universe of video games, and we are going to come with our brands.

But again, where are the VR sports games?

Ryan Batcheller is a 3D environment artist for JumpStart, a game designer, and creator of Virtual Screams, which hosts virtual haunt experiences using the Oculus Rift and aims to develop the content to run on the Samsung Gear VR. I first heard about Oculus from Batcheller at a party for a friend two years ago. His stories seized my imagination, flipped it inside out and tied a cherry stem around it. I felt woozy with excitement. It was too good to be true, I thought, as the cost of this tech would be too much for mass distribution. Batcheller’s exposure to VR began when he played a How to Train Your Dragon demo developed by Dreamworks. He tested the Oculus at work and bought both developer kits. He sees different challenges facing developers of VR sports titles.

“Sports games using VR will require a lot of testing with how the game play would work,” Batcheller said. “With the Wii you had people acting out motions in their home and hitting people, knocking over things and hurting themselves. That was with them being able to see and just being absorbed in the game. With VR they can’t see their surroundings. So with sports games I think the real trick is going to be designing game play that is fun and safe for the user who is immersed in the experience.”

In addition to the Oculus Rift launch in early 2016, Sony’s Project Morpheus will be a key to mass VR introduction. The PlayStation product is expected to be available by June of next year. Morpheus simply plugs in to the PS4, which has sold 22.3 million units to date. The marketplace already exists. With a Full HD 1920 x 1080 and 5.7-inch display with 100-degree field of vision and a refresh rate claimed to be higher than the Oculus Rift and HTC Vive (120Hz compared to 60Hz and 90Hz, respectively), Morpheus will contend for the top VR headset.

One rumor prices the Morpheus at $450, which will certainly hinder early adoption, even if it does include a full kit. Among the 21 announced titles, however, only one fits the sports genre. Project CARS, a motorsports game already available for the next gen consoles, is the lone sports title.

And what about Xbox? According to TechRadar, Microsoft’s VR headset development kits are in the hands of some game developers. But this was before the June 11 revelation that Microsoft has partnered with Oculus. Via Windows 10, Xbox One games will stream to the Rift headset as part of the virtual cinema Oculus has created.

The gear is coming.

“The new Oculus is completely mind-blowing, but while I’m bullish on the potential of VR to transform multiple industries, not least entertainment, it won’t be until 2016 that it truly starts becoming a viable consumer success,” said Mind Candy’s creative director Michael Action Smith to Vice.

Consumers just need the content when it comes to sports gaming in VR.

Part Two will discuss the upcoming gear, and how they can infiltrate the broadcast and athletic training spaces.

(Header image via Sergey Golyonkin)

MLB Fan Lawsuit Seeks Technological Remedy

Last month, Oakland A’s fan Gail Payne filed a class-action lawsuit against Major League Baseball in an effort to compel the league to provide more protective netting at all ballparks, including minor-league parks:

The Plaintiff and the Class are entitled to injunctive relief requiring Defendants, among other things, to adopt corrective measures regarding the implementation of: (1) a rule requiring all existing major league and minor league indoor and outdoor ballparks to be retrofitted to extend protective netting from foul pole to foul pole by the beginning of the 2016-2017 MLB season; (2) a rule requiring any newly constructed ballpark intended to house major or minor league baseball games, to include at a minimum this amount of netting; and (3) a program to study injuries and the rates of injuries amongst spectators, including the type and manner of injury and at what locations in ballparks they occur, in an effort to continually reevaluate whether additional measures should be taken, so that precautionary measures can continue to evolve as the sport continues to evolve.

As Nathaniel Grow wrote for FanGraphs, Payne’s lawsuit has a relatively low likelihood for success, due to the “several strong legal defenses” available to MLB and the possible applicability of “the so-called ‘Baseball Rule,’ a doctrine historically shielding MLB teams from legal liability for injuries incurred by fans from foul balls or broken bats.” (Payne attached to her complaint a “sample list of injuries suffered to spectators located in the unprotected areas along first and third base between the foul poles, during official play” that identifies about eighty-five such injuries since the early 1900s.)

If the case does go forward, though, it could present a few interesting questions. One is whether the U.S. District Court for the Northern District of California, where Payne’s case is pending, will apply the Baseball Rule. Last summer, the Georgia Court of Appeals refused to do so, affirming a trial judge’s rejection of a request by the Atlanta Braves (joined by the office of then-MLB Commissioner Bud Selig) to apply the rule and dismiss a lawsuit brought on behalf of a child whose skull was shattered by a foul ball at a Braves game.

A second question arises out of the procedural nature of Payne’s complaint, which seeks class-action treatment, and involves the means available to dissenters in the proposed class for challenging Payne’s position. Unlike the more popularly familiar “opt-out” class-action lawsuits, for which you may have received a coupon because you purchased overpriced energy drinks or music CDs, Payne’s proposed class action will proceed, if at all, under a different rule as a “mandatory” class action. Practically, this means that, if the court certifies Payne’s case as a class action, the final result of the case will bind every member of the class, which Payne broadly defines as all MLB season-ticket holders with seats “in any unnetted/uncovered area between home plate and the foul plates [sic] located at the end of the right and left field lines . . . .” As Grow suggested in his FanGraphs post, if the court grants her request for class certification, Payne could find herself with some unhappy fellow class members, as it seems likely that many MLB season-ticket holders with seats in what Payne’s complaint dubs “the Danger Zone” prefer their completely unobstructed views of the action and do not agree with Payne that the league should extend netting all the way to each foul pole. Because the proposed class is of the mandatory variety, though, dissenting class members could not simply opt out and control their own legal destinies. While yet another rule may allow those season-ticket holders who don’t want additional netting requested to intervene in the case and make their objections known, they must take affirmative steps to do so, and they must act in a timely fashion. A possible alternative, which Grow mentioned, is that MLB itself may point to this probable intra-class division in the course of its anticipated argument that the court should not allow the class action to proceed, thus relieving the dissenting class members from the need to do so. (On this point note that, on Monday, MLB filed a routine Disclosure of Interested Entities, which listed only the league’s thirty teams and their owners as among those entities having “a financial interest in the subject matter in controversy [or] having a non-financial interest in that subject matter . . . that could be substantially affected by the outcome of this proceeding.”) MLB’s answer to Payne’s complaint is due on October 2, 2015.

Third, and the reason for taking a look at this case over here at TechGraphs, Payne’s complaint raises a question of practical technology: How can we keep baseball fans safe while affording them the best available opportunity to enjoy baseball games? While the response from Payne’s legal and ideological opponents is that the fans themselves (and alone) bear the burden of ensuring their safety, an increase in fan-protection measures of some sort seems likely. MLB teams, including the aforementioned Braves, already employ extended netting during pregame activities, and further severe fan injuries could mobilize popular sentiment and personal injury lawyers to target MLB’s pockets, rather than merely its conscience.

To some, the pushback against increased safety netting should sound as a cry for technological innovation. As attitudes about netting change, a manufacturer who could produce stadium nets with reduced visual obtrusiveness seemingly would find himself or herself well-positioned to enter the market. (I contacted representatives for multiple MLB teams and netting manufacturers in connection with this story. None offered substantive comment, although one, Tex-Net, Inc. owner John Scarperia, indicated that he thought that the nets in use today already were as unobtrusive as possible while still providing the requisite degree of protection.)

And attitudes are likely to change. In 2002, thirteen-year-old Brittanie Cecil died as a result of injuries sustained when a deflected hockey puck struck her in the head during the course of an NHL game between the Calgary Flames and Columbus Blue Jackets. Three months later, the league, having completed a study of the issue, decided to significantly expand fan safety measures in its arenas by installing large safety nets at each end of the ice.

Image via Wikipedia
Image via Wikipedia

As Yahoo! hockey blogger Greg Wyshynski recalled in a post marking the tenth anniversary of Cecil’s death, negative fan reaction to the netting in 2002 was substantial and precisely in line with the remarks from 2015’s opponents to increased baseball netting. From the article announcing the new nets: “Some Blackhawks season ticket-holders said during the season that they would oppose having netting installed because it would interfere with their view of the game.” From a (oddly illuminated) contemporary editorial:

If spectators paid attention to the game, safety wouldn’t be a concern.

At the MCI Center in Washington, D.C., 122 fans were injured in 127 games, most of them weren’t serious, according to a report by two emergency room doctors. Meaning spectators were trying to be heroes by catching the puck and cutting their hand or something minor.

Don’t try to be heroes when the puck is traveling at 100 miles per hour; just duck.

The nets are good news to some people, such as the architects that build new arenas and stadiums. Now, with the nets, spectators will be able to see ice rinks where there are only 15-20 rows of seats behind the end zones and the rest near center ice. Taller and wider stadiums will be built as soon as the word gets out that no one can see through the nets.

Even Doug MacLean, then the general manager for– of all teams, the Blue Jackets– received angry mail: “It was shocking to me. When we put the nets up in Columbus [where Cecil was killed], I had some unbelievably nasty letters from season ticket-holders asking me how I could do that to their sight-lines.”

Wyshynski, who admitted he too was an early opponent of the netting, revisited the story ten years later not so much to chide or mock those early opponents but to observe just how much of an afterthought the netting had become since the initial outcry over its installation: “The purists bristled at the end of a tradition. Debates raged … and then a decade later, yesterday’s hot-button debate is today’s societal norm.” Should MLB ultimately follow the NHL in mandating new safety netting, it isn’t too difficult to imagine that, ten years down the road, your favorite baseball writer on whatever future version of TechGraphs exists at that time will have something similar to note.

(Header image via Rob Bixby)

YouTube’s Live-Streaming Potential for Sports is Growing

After representing Middle Earth in the Lord of the Rings films, New Zealand is once again the epicenter for fantasy and hopes sprung to life. Yesterday, YouTube secured broadcasting rights to the Bundesliga and will begin showing its soccer matches on Friday in real time from Germany. Time zone differences will be awfully tough on the Kiwis as a 2:30 Friday afternoon game goes live at 12:30 am in New Zealand. Ruined sleep patterns aside, merely seeing Google take live streaming so seriously could open up a new competition for sports broadcasting rights.

The Latest_Bundesliga Twitter account was among the first to break the cord cutter friendly news:

Sports Business Daily (subscription required) noted YouTube — and by extension Google — is also allowed to show additional games and highlights from the league, but as replays and not live.

YouTube previously streamed the opening match of Bundesliga season here in the United States, a matchup between three-time reigning champ Bayern Munich and Hamburg last Friday. With Fox Soccer owning the broadcast rights here, the game was streamed via their soccer page.

It’s hard to imagine YouTube not being interesting in the broadcast world, as they’ve been in the live streaming business for some time now, really kicking things off with their stream of the 2012 London Olympics. With events ranging from traditional sports to extreme and esports, as well as general content creators also getting in on the live broadcast game, YouTube already has a massive user base, huge infrastructure behind it, as well as name recognition and familiarity.

Further emphasis has been placed on YT’s trend of embracing esports as they streamed Dota 2’s largest yearly tournament, The International 5. At TI5, 16 qualified teams from around the world competed for a prize pool of over $18.4 million, with more than $6.6 million going to the winning team. Factor in the soon to be released YouTube Gaming platform, an aptly named area specifically for the broadcast of esports, speed runs, Let’s plays and more, clearly Google has taken a keen interest in bringing live content to people. Google securing the rights in New Zealand with their ~5 million residents could be a guinea pig or stepping stone of sorts for bigger things on the horizon here in the US. According to their second quarter 2015 report, Google increased revenue to $17.7 billion and revenue growth of 11 percent year-over-year. Ruth Porat, Google CFO commented on the revenue, specifically noting YouTube, said:

Our strong Q2 results reflect continued growth across the breadth of our products, most notably core search, where mobile stood out, as well as YouTube and programmatic advertising. We are focused every day on developing big new opportunities across a wide range of businesses. We will do so with great care regarding resource allocation.

Unfortunately it’s impossible to distinctly separate YouTube’s revenue stream from Google’s numerous other ventures, however it isn’t hard to imagine YouTube comparing similarly to traditional networks. Given that other broadcasting network reports don’t separate their revenue streams channel by channel, these numbers for sports networks should be taken with a grain of salt. CBS’s Q2 2015 report disclosed a $3.2 billion, increasing 1 percent compared to last year. Disney, owners of sports giants ESPN and ABC amongst other channels, reported Q2 earnings at $2.1 billion this season. Time Warner, controllers of TNT, and TBS et al. posted $7.3 billion, up 8 percent compared to 2014.

With plenty of money, a desired market for more streamed sports and clear goals moving towards streaming live broadcasts, Google and YouTube could once again transform the way the every person consumes their favorite sports, news and other media.


How To Use R For Sports Stats, Part 3: Projections

In this series, we’ve walked through how exactly you can use R for statistical analysis, from the absolute basics of R coding (in part 1) to visualizing data and correlation tests (in part 2).

Since you’re reading this on TechGraphs, though, you might be interested in statistical projections, so that’s how we’ll wrap this up. If you’re just joining us, feel free to follow along, though looking through parts 1 and 2 first might help everything make more sense.

In this post, we’ll use R to create and test a few different projection systems, focusing on a bare-bones Marcel and a multiple linear regression model for predicting home runs. I’ve said a couple times before that we’re just scratching the surface of what you can do — but this is especially true in this case, since people write graduate theses on the sort of stuff we’re exploring here. At the end, though, I’ll point you to some places where you can learn more about both baseball projections and R programming.

Baseline

Let’s get everything set up. We’ll have to start by abandoning –well, modifying– that test data set that served us so well in Parts 1/2; we’ll add another two years of data (2011-14), trim out some unnecessary stats, and add a few which might prove useful later on. It’s probably easiest just to download this file.

Then we’ll load it:

fouryr = read.csv("FG1114.csv")

convert some of the percentage stats to decimal numbers:

fouryr$FB. = as.numeric(sub("%","",fouryr$FB.))/100
fouryr$K. = as.numeric(sub("%","",fouryr$K.))/100
fouryr$Hard. = as.numeric(sub("%","",fouryr$Hard.))/100
fouryr$Pull. = as.numeric(sub("%","",fouryr$Pull.))/100
fouryr$Cent. = as.numeric(sub("%","",fouryr$Cent.))/100
fouryr$Oppo. = as.numeric(sub("%","",fouryr$Oppo.))/100

and create subsets for each individual year.

yr11 = subset(fouryr, Season == "2011")
colnames(yr11) = c("2011", "Name", "Team11", "G11", "PA11", "HR11", "R11", "RBI11", "SB11", "BB11", "K11", "ISO11", "BABIP11", "AVG11", "OBP11", "SLG11", "WAR11", "FB11", "Hard11", "Pull11", "Cent11", "Oppo11", "playerid11")
yr12 = subset(fouryr, Season == "2012")
colnames(yr12) = c("2012", "Name", "Team12", "G12", "PA12", "HR12", "R12", "RBI12", "SB12", "BB12", "K12", "ISO12", "BABIP12", "AVG12", "OBP12", "SLG12", "WAR12", "FB12", "Hard12", "Pull12", "Cent12", "Oppo12", "playerid12")
yr13 = subset(fouryr, Season == "2013")
colnames(yr13) = c("2013", "Name", "Team13", "G13", "PA13", "HR13", "R13", "RBI13", "SB13", "BB13", "K13", "ISO13", "BABIP13", "AVG13", "OBP13", "SLG13", "WAR13", "FB13", "Hard13", "Pull13", "Cent13", "Oppo13", "playerid13")
yr14 = subset(fouryr, Season == "2014")
colnames(yr14) = c("2014", "Name", "Team14", "G14", "PA14", "HR14", "R14", "RBI14", "SB14", "BB14", "K14", "ISO14", "BABIP14", "AVG14", "OBP14", "SLG14", "WAR14", "FB14", "Hard14", "Pull14", "Cent14", "Oppo14", "playerid14")

(We’re renaming the columns for each subset because the merge() function has some problems if you try to merge too many sets with the same names. If you want to explore the less hacked-together way of reassembling data frames in R, take a look at the dplyr package.)

Anyway, we’ll merge these all back into one set:

set = merge(yr11, yr12, by = "Name")
set = merge(set, yr13, by = "Name")
set = merge(set, yr14, by = "Name")

Still with me? Good. Thanks for your patience. Let’s start testing projections.

Specifically, we’re going to see how well we can use the 2011-2013 data to predict the 2014 data. For simplicity’s sake, we’ll focus mostly on a single stat: the home run. It’s nice to test with–it’s a 5×5 stat, it has a decent amount of variation, it gives us experience with testing counting stats while being more player-controlled than R/RBI… and, come on, we all dig the long ball.

Now when you’re testing your model, it’s nice to have a baseline–a sense of the absolute worst that a reasonable model could do. For our baseline, we’ll use previous-year stats: we’ll project that a player’s 2013 HR count will be exactly what they hit in 2014.

To test how well this works, we’ll follow this THT post and use the mean absolute error–the average number of HRs that the model is off by per player. So if a system projects two players to each hit 10 homers, but one hits zero and the other hits 20, the MAE would be 10.

(If you end up doing more projection work yourself, you may want to try a more fine-tuned metric like r² or RMSE, but I like MAE for a basic overview because the value is directly measurable to the stat you’re examining.)

To find the mean absolute error, take the absolute value of the difference between the projected and actual stats, sum it up for every player, then divide by the number of players you’re projecting:

sum(abs(set$HR13 - set$HR14))/length(set$HR14)
> [1] 6.423729

So the worst projection system possible should be able to beat an average error of about six and a half homers per player.

Marcel, Marcel

Now let’s try a slightly-less-than-absolute-worst model.

Marcel is the gold standard of bare-bones baseball projections. At its core, Marcel predicts a player’s stats using the last 3 years of MLB data. The previous year (Year X) gets a weight of 5, the year before (X-1) gets a weight of 4, and X-2 gets a weight of 3. As originally created, Marcel also includes an adjustment for regression to the mean and an age factor, but we’ll set aside such fancies for this demonstration.

To find Marcel’s prediction, we’ll create a new column in our dataset weighing the last 3 years of HRs. Since our weights are 5 + 4 + 3 = 12, we’ll take 5/12 from the 2013 data, 4/12 from the 2012 data, and 3/12 from the 2011 data. Then we’ll round it to the nearest integer.

set$marHR = (set$HR13 * 5/12) + (set$HR12 * 4/12) + (set$HR11 * 3/12)
set$marHR = round(set$marHR,0)

Voila! Your first (real) projections. How do they perform?

sum(abs(set$marHR - set$HR14))/length(set$HR14)
> [1] 5.995763

Better by nearly half a home run. Not bad for two minutes’ work. 6 HR per player still seems like a lot, though, so let’s take a closer look at the discrepancies. We’ll create another column with the (absolute) difference between each player’s projected 2014 HRs and actual 2014 HRs, then plot a histogram displaying these differences.

set$mardiff = abs(set$marHR-set$HR14)
hist(set$mardiff, breaks=30, col="red")
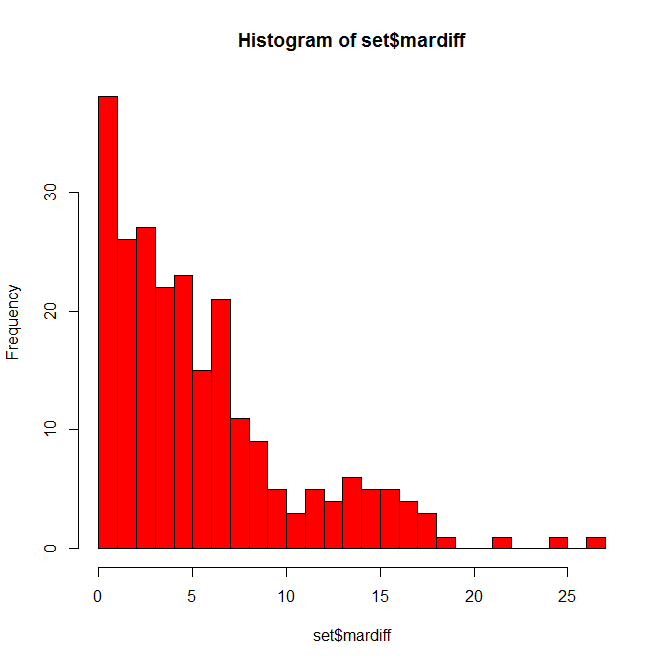
Histogram of Marcel HR errors

Not as bad as you might have thought. Many players are only off by a few home runs, some off by 10+, and a few fun outliers hanging out at 20+. Who might those be?

set = set[order(-set$mardiff),]
head(set[c(1,72,90,91)], n=10)

(In that last line, we’re calling specific column names so we don’t have to search through 100 columns for the data we want when we display this. You can find the appropriate numbers using colnames(set).)
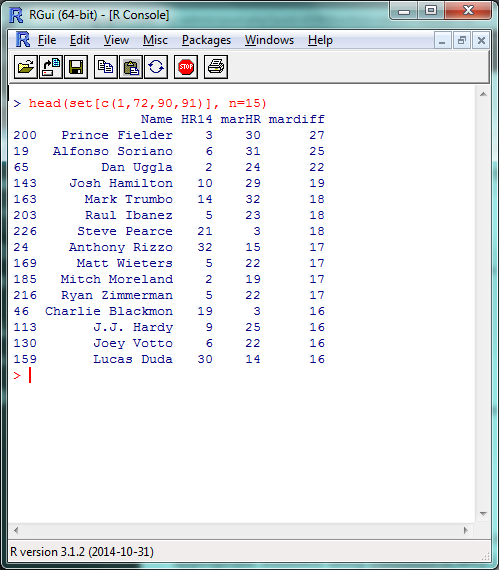
List of players with largest Marcel HR errors

A list headlined by a season-ending injury and two players released by their teams in July; fairly tough to predict in advance, IMO.

While we’re here, let’s go ahead and create Marcel projections for the other 5×5 batting stats:

set$marAVG = (set$AVG13 * 5/12) + (set$AVG12 * 4/12) + (set$AVG11 * 3/12)
set$marAVG = round(set$marAVG,3)
set$marR = (set$R13 * 5/12) + (set$R12 * 4/12) + (set$R11 * 3/12)
set$marR = round(set$marR,0)
set$marRBI = (set$RBI13 * 5/12) + (set$RBI12 * 4/12) + (set$RBI11 * 3/12)
set$marRBI = round(set$marRBI,0)
set$marSB = (set$SB13 * 5/12) + (set$SB12 * 4/12) + (set$SB11 * 3/12)
set$marSB = round(set$marSB,0)

And, for good measure, save it all in an external file. We’ll create a new data frame from the data we just created, rename the columns to look nicer, and write the file itself.

marcel = data.frame(set$Name, set$marHR, set$marR, set$marRBI, set$marSB, set$marAVG)
colnames(marcel) = c("Name", "HR", "R", "RBI", "SB", "AVG")
write.csv(marcel, "marcel.csv")

Before we move on, I want to quickly cover one more R skill: creating your own functions. We’re going to be using that absolute mean error command a couple more times, so let’s create a function to make writing it a bit easier.

modtest = function(stat){
 ame = sum(abs(stat - set$HR14))/length(set$HR14)
 return(ame)
}

The ‘stat’ inside function(stat) is the argument you’ll be including in the function (here, the column of projected data we’re testing); the ‘stat’ shows up inside the bracketed text where your projected data did when we originally used this command. The return() is what your function outputs to you. Let’s make sure it works by double-checking our Marcel HR projection:

modtest(set$marHR)
> [1] 5.995763

Now we can just use modtest() to find the absolute mean error. Functions can be as long or as short as you’d like, and are incredibly helpful if you’re using a certain set of commands repeatedly or doing any sort of advanced programming.

Hold The Line

With Marcel, we used three factors–HR counts from 2013, 2012, and 2011–with simple weights of 5, 4, and 3. For our last projection model, let’s take this same idea, but fine-tune the weights and look at some other stats which might help us project home runs. This, basically, is multiple linear regression. I’m going to handwave over a lot of the theory behind regressions, but Bradley’s how-to from last week does a fantastic job of going through the details.

Remember back in part 2, when we were looking at correlation tests in r² and we mentioned how we were basically modeling a y = mx + b equation? That’s basically what we did with Marcel just now, where ‘y’ was our projected HR count and we had three different mx values, one each for the 2013, 2012 and 2011 HR counts. (In this example, ‘b’, the intercept, is 0.)

So we can then use the same lm() function we did last time to model the different factors that can predict home run counts. We’ll give R the data and the factors we want it to use, and it’ll tell us how to best combine them to most accurately model the data. We can’t model the 2014 data directly in this example–since we’re testing our model against it, it’d be cheating to use it ‘in advance’–but we can model the 2013 HR data, then use that model to predict 2014 HR counts.

This is where things start to get more subjective, but let’s start by creating a model using the last two years (2013/2012) of HR data, plus the last year (2012) of ISO, Hard%, and Pull%. In the lm() function, the data we’re attempting to model will be on the left, separated by a ‘~’; the factors we’re including will be on the right, separated by plus signs.

hrmodel = lm(set$HR13 ~ set$HR12 + set$HR11 + set$Hard12 + set$Pull12 + set$ISO12)
summary(hrmodel)
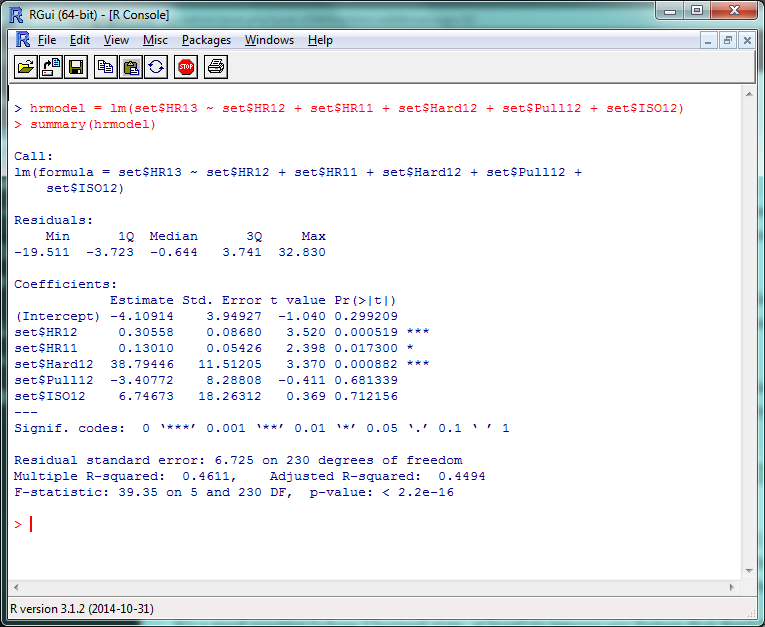
Screenshot of initial linear model

There’s a lot of stuff to unpack here, but the first things to check out are those “Pr(>|t|)” values in the right corner. Very simply, a p-value less than .05 there means that that factor is significantly improving your model. (The r² for this model, btw, is .4611, so this is accounting for roughly 46% of the 2013 HR variance.) So basically, ISO and Pull% don’t seem to add much value to this model, but Hard% does.

It’s generally a good practice to remove any factors that don’t have a significant effect and re-run your model, so let’s do that:

hrmodel = lm(set$HR13 ~ set$HR12 + set$HR11 + set$Hard12)
summary(hrmodel)
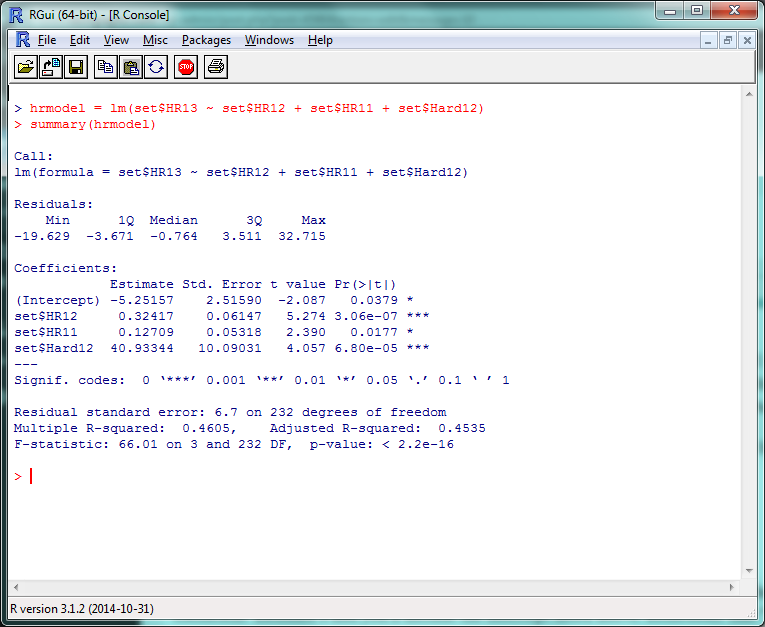
Screenshot of R model with significant factors

And there’s your multiple linear regression model. The format for the actual projection formula is basically the same as what we did for Marcel, except your weights will take the coefficient estimates and you’ll include the intercept listed above them. Remember that “HR12”, “HR11”, etc., are standing in for “last year’s HR total”, “the year before that’s HR total”, etc., so make sure to increment the stats by a year to project for 2014.

set$betHR = (-5.3 + (set$HR13 * .32) + (set$HR12 * .13) + (set$Hard13 * 40))
set$betHR = round(set$betHR,0)

Survey says…?

modtest(set$betHR)
> [1] 5.95339

…oh. Yay. So that’s an improvement of, uh…

modtest(set$marHR) - modtest(set$betHR)
> [1] 0.04237288

1/20th of a home run per player. Isn’t this fun? Some reasons why we might not have seen the improvement we expected:

  • We probably overfit the data. Since we ran the model on 2013 data, it probably did really well on 2013 data, but not as great on 2014. If we check the model on the 2013 data:
set$fakeHR = (-5.3 + (set$HR12 * .33) + (set$HR11 * .13) + (set$Hard12 * 40))
set$fakeHR = round(set$fakeHR,0)
sum(abs(set$fakeHR - set$HR13))/length(set$HR13)
> [1] 4.877119

It runs pretty well.

  • We didn’t include useful factors we could have. We just tested a few obvious ones; maybe looking at Cent% or Oppo% would be more helpful than Pull%? (They aren’t, just so you know.) More abstract factors like age, ballpark, etc., would obviously help–but including these would also require a stronger model.
  • Finally, projections are hard. Even if you have an incredibly customized set of projections, you’re going to miss some stuff. Take a system like Steamer, one of the most accurate freely-available projection tools around. How did their 2014 preseason projections stack up?
steamer = read.csv("steamer.csv")
steamcomp = merge(yr14, steamer, by = "playerid14")
steamcomp$HR = as.numeric(paste(steamcomp$HR))
steamcomp$HR = round(steamcomp$HR, 0)
steamcomp$HR[is.na(steamcomp$HR)] = 0
sum(abs(steamcomp$HR - steamcomp$HR14))/length(steamcomp$HR14)
> [1] 4.892157

That said, the lesson you should not take away from this is “oh, our homemade model is only 1 HR/player worse than Steamer!” Our data set is looking at players for whom we have several seasons’ worth of data —   the easiest players to project. If we had to create a full-blown projection system including players recovering from injury, rookies, etc., we’d look even worse.

If anything, this hopefully shows how much work the Silvers, Szymborskis, and Crosses of the world have put in to making projections better for us all. Here’s the script with everything we covered.

This Is Where I Leave You

Well, that about wraps it up. There’s plenty, plenty more to learn, of course, but at this point you’ll do well to just experiment a little, do some Googling, and see where you want to go from here.

If you want to learn more about R coding, say, or predictive modeling, I’d definitely recommend picking up a book or trying an online class through somewhere like MIT OpenCourseWare or Coursera. (By the end of which, most likely, you’ll be way beyond anything I could teach you.) If there’s anything particular about R you’d still like to see covered, though, let me know and I’ll see if I can do a writeup in the future.

Thanks to everyone who’s joined us for this series — the kudos I’ve read here and elsewhere have been overwhelming — and thanks again to Jim Hohmann for being my perpetual beta tester/guinea pig. Have fun!


TechGraphs News Roundup: 8/14/2015

And heat and humidity wave has swept the American Middle West this week, and my primary laptop is not particularly happy about it. Nevertheless, let’s beat the heat by catching up on some of the sports-tech stories we here at TechGraphs found interesting this week.

I talked about MLB Advanced Media’s plans after their deal with the NHL, and it appears as if the other shoe has dropped as MLBAM has officially been spun off as its own entity — BAM Tech.

Colt’s quarterback Andrew Luck integrated (auto-play warning) virtual reality into his offseason training. It seems as if Stanford ties can help in all sorts of ways.

Speaking of nerdiness and football, the Denver Broncos are bringing their head of analytics up in the coach’s booth this year, where he will help the staff with on-the-fly analysis. If it brings down the amount of punting in the NFL, I’m all for it.

And when a team decides to go for it, there’s a good chance you’ll hear about it on Twitter this season. The NFL has teamed up with the social media giant to bring more news and highlights into people’s Twitter feeds. Yay?

I’ll be attending the final round of the PGA Championship on Sunday, but don’t expect me to post any pictures of it. I mean, I probably wouldn’t anyway, but it appears as if the PGA is cracking down on un-credentialed photogs at their tournaments.

In esports news, the League of Legends Championship Tournament is featuring a woman for the first time. The worlds of sports and technology haven’t always been the most diverse, so it’s nice to see some, albeit gradual, change.

While we’re talking about gaming tournaments, it sounds like Blizzard might be making a push into that world.

That’s all for this week. Have a good weekend. Be excellent to each other.


How to Follow the PGA Championship Online This Week

Golf’s final men’s major championship of the year kicks off today in my home state of Wisconsin at Whistling Straits Golf Course. The main headline revolves around two young starts, Rory McIlroy and Jordan Speith, and their reluctant rivalry coming in to the tail end of the PGA season. Whether you are a fan of those two, other competitors in the field, or just like to follow along with the event, you have multiple options for staying in the know during the tournament.

Watching

If you plan on being a couch potato all weekend, then a mixture of the TNT network and CBS will have you covered. You can check the tournament’s main page for broadcasting schedules. If you have a cool boss or a strategically-placed cubicle, you can also use PGA.com to stream video on Friday. You will be able to watch the traditional broadcast (when available), or follow a featured group around the course.

The PGA is also offering dedicated apps for both Android and iOS. The apps will allow you watch much of the same offerings as the web site, though it does appear that the app will make you register with an email address. At the time of this writing, I couldn’t find out if cable/satellite credentials are necessary once CBS takes over coverage for the weekend.

The PGA Championship app for iOS.

Other Ways to Follow Along

If you’ll be out and about and unable to glue yourself to a screen, you will have other options. The aforementioned apps also have leaderboard functionality baked in, and also allow you to select favorite players to follow. You can set up alerts for these players, or for tournament news in general. A helpful buzz might be more convenient than having to pull out your phone every five minutes. The app also cultivates tweets for you, if you wish, so you can see what journalists and other big names in golf are saying about the course and players’ performances.

If you don’t feel like adding yet another app to your growing stable, any sports news app that you currently have should suffice in keeping you up to date. I am a big fan of the CBS Sports app in general, and as that network is covering the tournament, you can bet they’ll be on the ball with updates. The CBS app also provides cultivated tweets from people of import in golf.

The PGA section of the CBS Sports app on Android.

A difficult course coupled with some challenging weather should make for some interesting golf. Whether one of the household names or a more unknown pro makes a run at the Wanamaker Trophy remains to be seen, but armed with the proper tech, you should have no problem following along.


How To Run Sports Data Regressions in Microsoft Excel

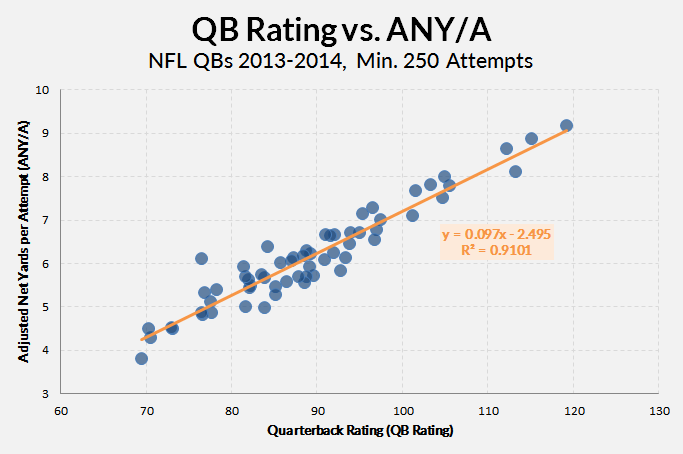
The shorthand description of a regression: It’s the best possible trend line between a scatter of dots. Like this:

The orange line (and the connected equation) represent the most basic idea of a regression.

One of the fun things about regressions is that they give us formulas — line equations, specifically. So if we have a quarterback with a 100 QB rating, we can plug his 100 into our formula (y = 0.097 * 100 – 2.495) and get a reasonable estimation of what his Adjusted Net Yards per Pass Attempt (ANY/A) would be (about 7.2). The R2 tells us essentially how reliable the regression is — or, more specifically, how much of the variation in QB Rating is explained by ANY/A.

Of course, the problem with the data here (which I just kind of threw together as an example) is that QBR and ANY/A use almost the same inputs and attempt to do the same thing. It’s nice to see they have about 91% overlap (it basically says they’re just about interchangeable), but no one is going to use QB rating to derive or forecast a ANY/A.

Regressions are more useful when we start with something small and reliable, then move our way to more all-encompassing but volatile stats. This is like how we use contact or plate discipline data (small and reliable) to expand into an xBABIP calculator (big and more meaningful).

There are two ways to run some regressions in Excel:

  1. Use the scatterplot tool (as above) and create a simple, two-variable regression.
  2. Use the Data Analysis ToolPack to run a more complete and useful regression.

The first method is the easiest, but it doesn’t output the peripheral data that is essential to fully understanding a regression’s findings.

The Scatterplot Regression

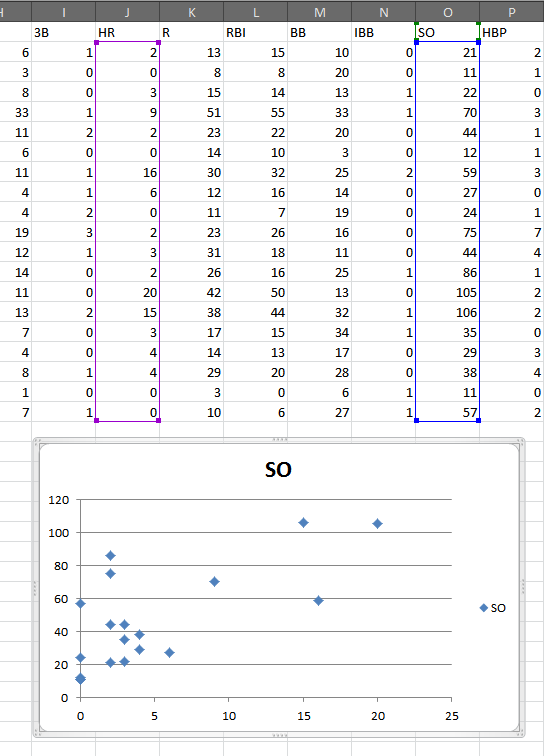
For the first method, just select two columns of data and make a scatterplot (Insert > Scatter). That will give you something like this:

Here's a scatterplot of the 2015 Durham Bulls' strikeout and home run totals.
Here’s a scatterplot of the 2015 Durham Bulls’ strikeout and home run totals, min. 50 PA.

With the chart selected, choose to add a linear trendline (Layout > Trendline > Linear Trendline):

Adding a linear trendline will create a basic linear regression.

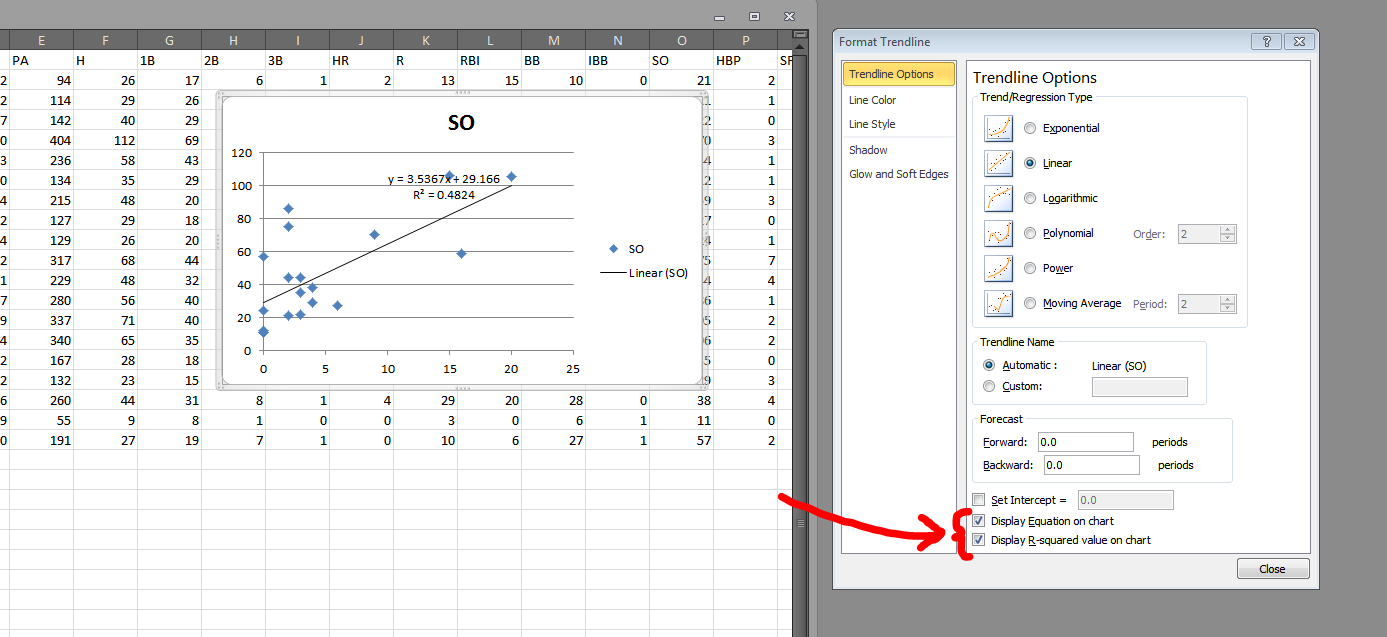
Now double-click the trendline to produce the “Format Trendline” window. In that menu, check the boxes for “Display Equation on chart” and “Display R-squared on chart”:

These two boxes give you the bare minimum of data necessary to interpret a regression.

So now we have a regression! The formula (HR = 3.5367 * SO + 29.166) tell us there is a positive connection between home run totals and strikeout totals. And the R2 tells us the relationship between HR and SO explains 48% of the variation between the two of them.

What this regression doesn’t tell us:

  • What direction, if any, is the causality? Are homers causing players to strikeout? Or do more strikeouts make more homers?
  • Are their peculiarities in the residuals? This article does a great job of teaching how to interpret residuals plots.
  • Does the regression fit the data? And ANOVA analysis can be useful in augmenting what the R2 tells us.

The first issue is a matter of deeper research. A regression won’t tell us direction of causality. But we can still answer those other two questions — as well as add more variables — using Excel data Analysis ToolPack. The first thing we’ll need to do is enable that ToolPack.

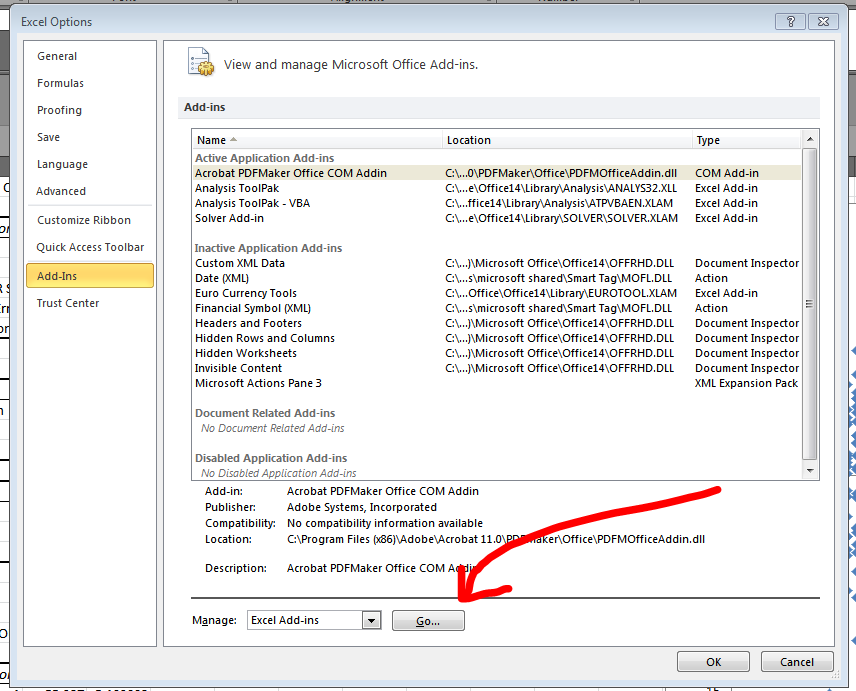
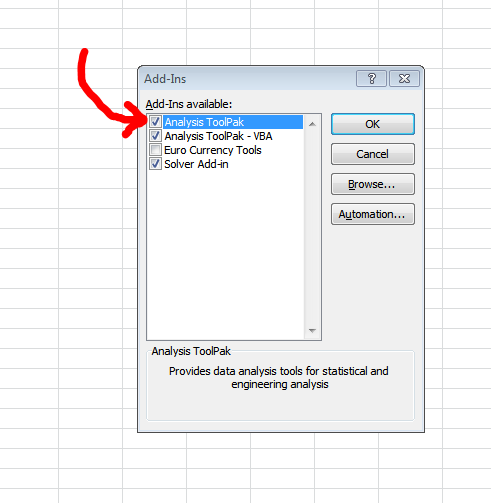
In the File > Options > Add-Ins section, you’ll notice a “Go…” button at the bottom of the window.

This button opens a dialogue that allows us to turn on the data Analysis ToolPack. Why is this not enabled by default? Who knows? Maybe Bill Gates.

Select the top option in the available Add-Ins (“Analysis ToolPack”) and then click “OK.”

You can also add in these other ones if you're feeling frisky. I rarely use them, though.
You can also add in these other ones if you’re feeling frisky. I rarely use them, though.

Now, after this first step, you should have a new option in your Data tab. Let’s explore that. Go to Data > Data Analysis. That will open a simple dialogue with a list of various operations. Choose “Regression” and click “OK”.

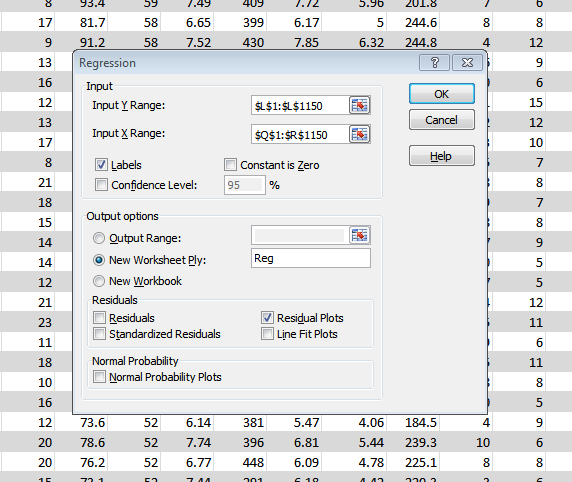
You should then get this screen:

The Y Range will be what you are regression against, so to speak.

In the Y Range text box, you will want to add only a single column of data. I prefer to include the column headings so that the output screen will be more easily understood. In this instance, I’m choosing a big column of completions percentage data from Pro-Football-Reference.com (from this data: NFL QB seasons since 1969 with min. 10 TD). I’m regression this Cmp% data against the quarterbacks sack total and yards per attempt (Y/A) total.

In short, I’m asking: Can Y/A and sack totals predict a QB’s accuracy?

So in the X Range, I’m going to select the Q and R columns (titles and all). The output is something like this:

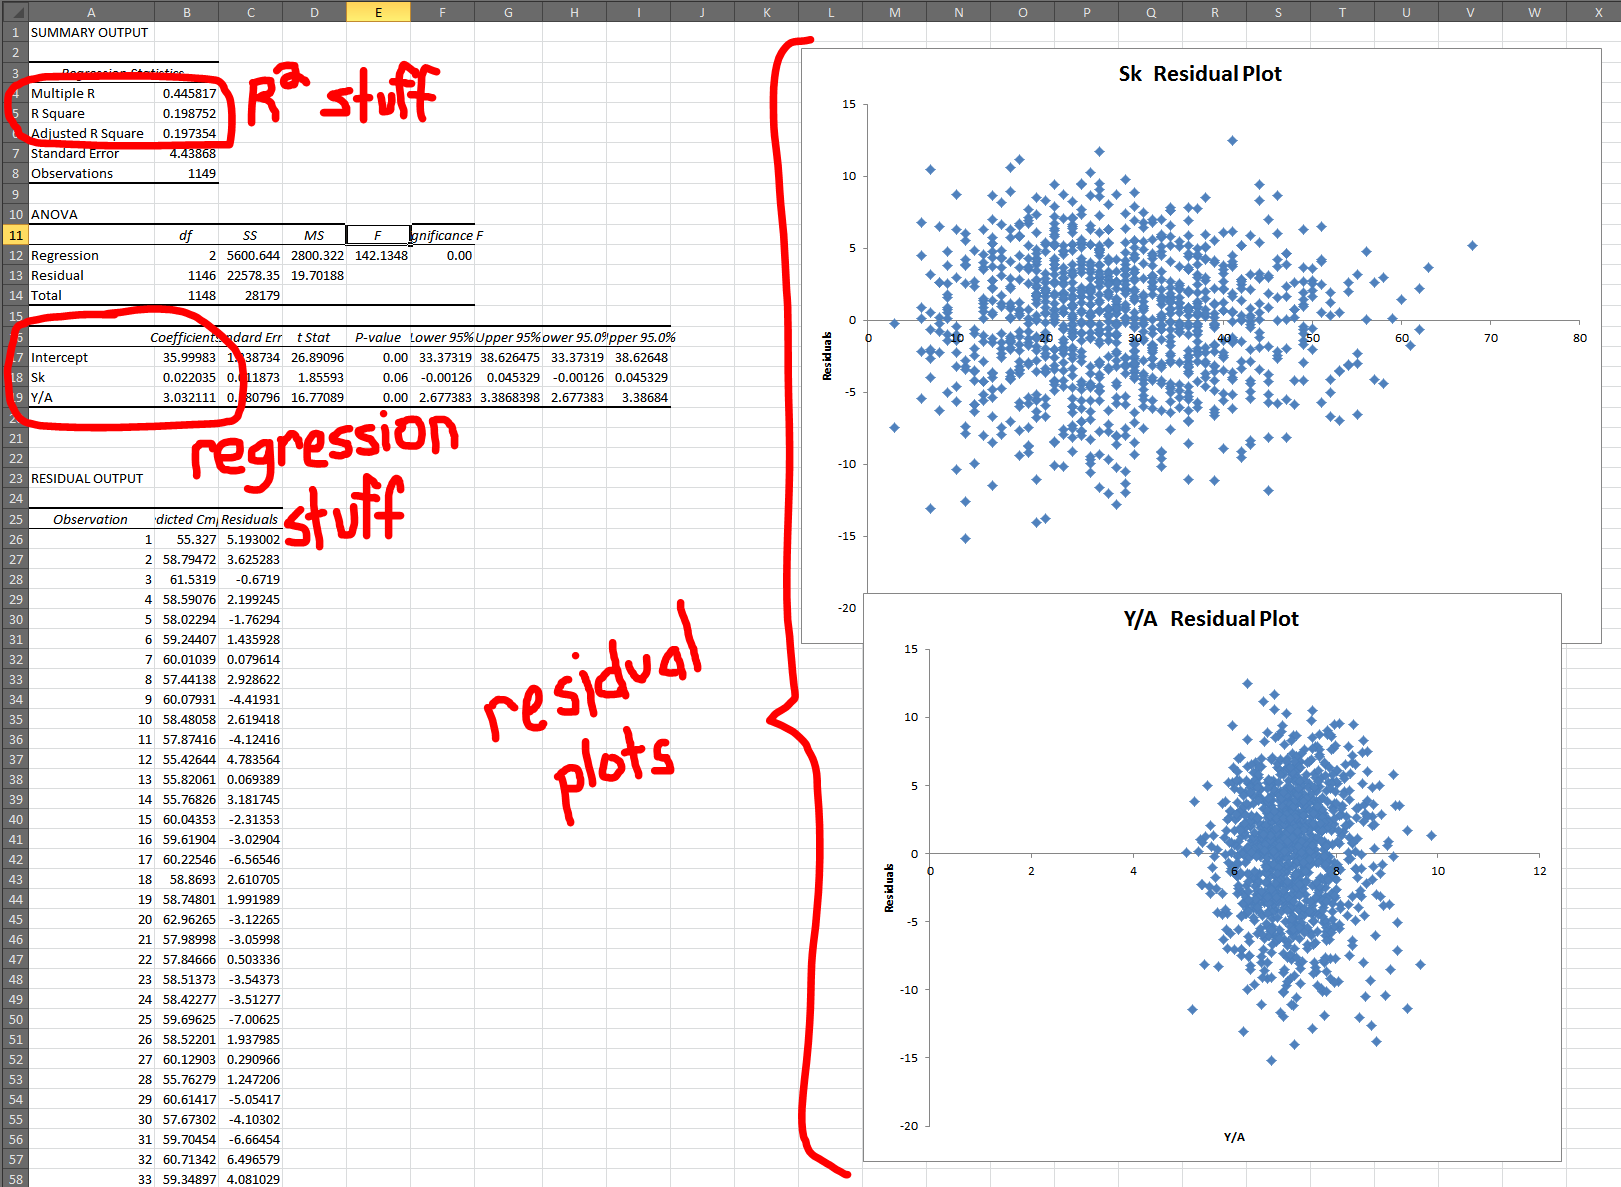
Here are the big three components of a regression.

So this is kinda what it will look like after a regression. Let’s break down the three big areas one at a time, in the typical order I look at them:

  1. Residual Plots: These look good! You want a shotgun blast looks. If you start to see anything other than a circle, in any of your residual plots, then you’ll need to rework your regression. (See that above article for more details.)
  2. R2 Results: What is a good R2? Well, higher is always (well, usually) better, but there’s no clear perfect R2. Truth is, we have to be as intellectually honest as possible and determine how much explanation is the right amount of explanation. With multiple variables, it’s important to look at Adjusted R2 because it helps combat the unintentional increase in R2 caused by just adding more data. In this case, though, R2 and Adjusted R2 are about the same, so whutevz.
  3. Coefficients: The coefficients tell us both the formula of the regression (Cmp% = 36 + 0.02 * Sacks + 3.03 * Y/A) but also the strength of the variables involved. And it doesn’t take much work realized which variable is more important. Even a QB who has been sacked will only see his Cmp% moved by 1.5%. What’s more: It increases 1.5%. That’s a red flag right there for a bad variable. Maybe Sack% would be a more useful tool because the sack totals are merely telling us he played more (and QBs who played more probably had better performances because otherwise they would have been benched).

Anyway, I hope this has been helpful. I encourage readers to learn more about regression before attempting any, as they are a complicated and tricky tool and can lead a researcher astray quickly if used incorrectly.

NOTE: For those wondering why I haven’t gone into detail about significance testing for P-values, it’s because I believe that field of statistical study is generally arbitrary and altogether intellectually bankrupt. But there are dozens of great tutorials out there on the subject. I just can’t in good ethical faith write one.


GameOn Releases Sports Social Networking App

In a continued effort to personalize and curate the world of sports to each person’s preference, the GameOn app — developed by GameOn Technologies — recently secured funding for additional expansion across the iOS and Android platforms. Among the backers who helped raise 1.5 million dollars was Hall of Fame quarterback Joe Montana as well as West Indian cricket player Dwayne Bravo. In addition to Montana and Brave a number of other athletes have signed on to give exclusive content — ranging from USWNT striker Sydney Leroux, former USMNT midfielder Cobi Jones and current Denver Broncos safety T.J. Ward.

The app itself ties news feeds from other sources in one convenient place called The Five. Think of The Five like an aggregator or RSS for all sports.

gameonthefive1

From browsing GameOn — drawing articles and tweets ESPN, Grantland, SB Nation, BBC, CBS Sports and others, — there is plenty of reading material for the major sports teams. Unfortunately there is not a way to customize what appears on The Five, it seems to pick whichever articles or tweets are currently getting the most attention. The good news is just about anything else can be tweaked to show which teams you’d like to follow.

It’s a personal preference, but when opening a story from The Five, it does not give the option to open in Chrome — I don’t have an iOS device to see if Safari was an option — as tapping a link simply opens up the story within GameOn. It isn’t a hindrance or particularly inconvenient, I just like opening links in new tabs and windows. Call it a hangover effect from years of opening links in Chrome with my Mouse3 button.

In addition to specific teams and featured articles, there are individual “Featured Public Huddles” where fans can join and debate with each other, related links are posted, and a host of emoji-like stickers can be used.

gameonfeaturedhuddle
For an example of a what can only be assumed to be a clearly unbiased opinion, user Cristiano The Beaut (presumably named for Real Madrid star Cristiano Ronaldo) calls Lionel Messi a “dirty and overrated player.” I’d recommend a spoon to take all those grains of salt with that opinion.

gameonfanbanter

Huddles is just the name GameOn gives team or game threads, and in addition to the public “Featured” ones, any user can create private Huddles as well.

As I find myself more and more interested in following the German soccer league, the Bundesliga, I decided to create a pair of Huddles for their upcoming fixtures against Hoffenheim and Hannover. From my phonebook or friends within the GameOn app, I can invite people to join in the Huddle.

gameonprivatehuddle

The stickers — there are hundreds if not thousands of them — are a unique feature and I really like the multi-site integration and aggregate feed. But really, the stickers are awesome.

gameonstickers

Even with the fun and smack-talk-integration the stickers offer, GameOn really doesn’t differentiate itself from other sports apps, specifically Fancred. Additionally, Twitter’s influence on the sports social network scene, despite not being marketed as a sports-centric app, looks as strong as ever given numbers from their second quarter of this year. According to the financial report, Twitter increased their average active monthly user base from 308 million in Q2 2014 to 316 million Q2 2015. GameOn has a solid beginning, however with a modest 50,000 or so downloads in its first year of Beta testing, it has a long way to go to reach the top of the sports social network world.


TechGraphs News Roundup: 8/7/2015

It’s a busy time for sports these days. The baseball pennant chase is heating up, NFL training camps are starting, the EPL is about to start another season, and the final PGA major of the season begins in just a few days. We can understand if you missed news, so here are all the sports-tech stories we found interesting this week.

Daily fantasy sites are making money hand over fist, but not everything is sunshine and rainbows for them. DraftKings is facing some class-action lawsuits, and the Boston Globe has some details.

SAP teamed up with women’s professional tennis a while back to provide in-game stats and insight to coaches and players. It seem that, now, coaches will be able to use these numbers — via an iPad — on the court.

Our very own (and very brave) Bradley Woodrum experimented with the meal replacement program from Soylent to mixed reviews. Well, Soylent is back with a new formula and a new ready-to-drink delivery method.

Microsoft partnered up with the NFL last year to provide Surface Pro 2 tablets to teams to use on the sidelines. It went … not as well as expected. But, the Surfaces are back for another NFL season, this time in their fancy Pro 3 form.

While on the topic of Microsoft, they also debuted a fancy new app for both Windows 10 and the Xbox One. At the heart of the new tech is something called Next Gen Stats, a hyper-granular replay system utilizing RFID chips embedded within players’ shoulder pads.

EPL teams are getting their own emoji on Twitter this season. So … that’s a thing.

Finally, Disney’s Bob Iger had an interview with the Wall Street Journal in which he opined that ESPN will be a direct-to-customer product at some point down the road. We, of course, have figured this for some time, but it’s nice to hear that from a muckety-muck. No news on when that will happen yet, of course.

That’s all for this week. Have a great weekend, and be excellent to each other.