Archive for Uncategorized

How To Use R For Sports Stats: Visualizing Projections

If you’re reading TechGraphs right now, there’s a good chance you’re prepping for fantasy baseball, and if you’re doing that, there’s a good chance you’re making use of projection systems like Steamer or ZiPS. In this post, we’ll explore some basic tools that might help you look at these projections in a new way — and brush up on those R skills that you probably haven’t touched since last fall.

(From a skills perspective, this post will assume that you’ve previously read through the “How To Use R For Sports Stats” series. Even if you haven’t, the insights below will hopefully still be worth your while. I’d also be terribly remiss if I didn’t point you towards Bill Petti’s recent THT post unveiling his baseballr R package.)

We’ll use Steamer projections for this post, though the methods we’ll look at can be used with ZiPS, FG Depth Charts, or, for that matter, actual by-season data. Download Steamer’s 2016 batting projections from FanGraphs, rename the file to “steamer16.csv”, and load it up in R. We’ll remove players projected for fewer than 100 AB to clean up the data a bit:

steamer = read.csv("steamer16.csv")
steamer = subset(steamer, PA > 100)

Visualizing Tiers

As fantasy baseball managers, we all have an innate ability to estimate a player’s value from their stats, judging how good a 30/10/.285 player is vs. a 15/15/.280. We get pretty good at this if we want to do well in our leagues — but we can still develop blind spots in our assessments, or hold on to an outdated idea of quality as MLB trends change. (For example, the average AVG in MLB has dropped from the high .260s 10 years ago to the low .250s today; if you’re still thinking a .255 hitter is below average, you might want to reconsider.)

The point, then, is that if you’re getting a sense of how good a player will be by looking at their projections, it can be helpful to step back and recalibrate your thinking from time to time by looking at the broader trends in an image or two.

Let’s look at Steamer’s projections for stolen bases, for example. We’ll draw on what we learned back in part 2 to make a quick-and-hasty histogram counting the number of MLB players who are projected for different SB totals:

hist(steamer$SB, breaks = 30)
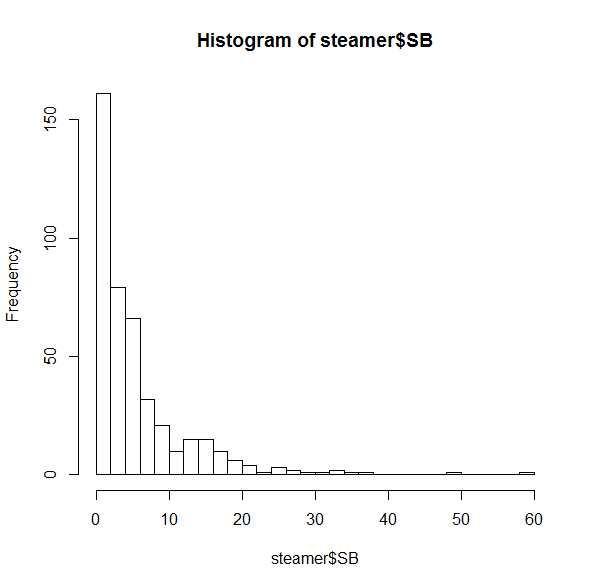
Basic histograph of SB projections

Most of these players are projected for fewer than 10 SB. This is sort of interesting, but their huge counts are keeping us from seeing the trends on the right side. Let’s zoom in a bit:

hist(subset(steamer, SB > 10)$SB, breaks=30)
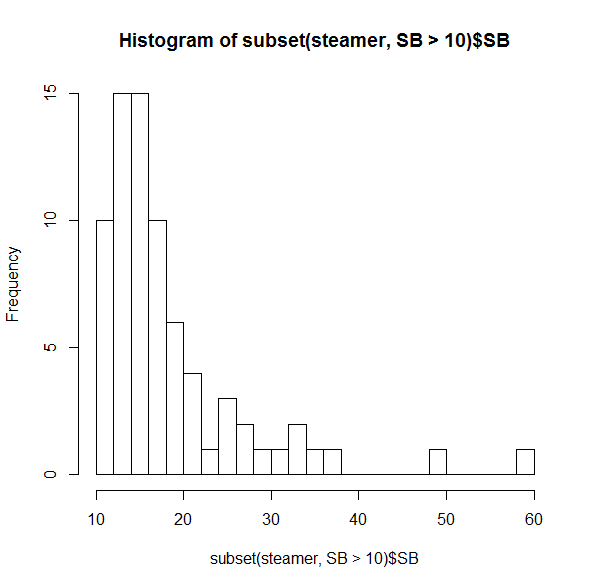
Histograph of SB projections for > 10 SB

Even among this crowd of speedsters, it’s uncommon to see someone projected for more than 20 SB, and incredibly rare to have more than 30.

You probably didn’t need to be reminded that the two folks on the far right (spoiler alert: Billy Hamilton and Dee Gordon) would stand out, though it’s useful to see just how distant they are from everyone else. But if you were thinking that players like Jarrod Dyson (35 projected SB) or Billy Burns (32) are solid, but not elite, on the basepaths, it may be time to reassess. (Did I mention that SB totals in MLB dropped 25% between 2011 and 2015?)

If you’re the kind of person who prefers boxplots instead, R’s got just the thing:

boxplot(steamer$SB)
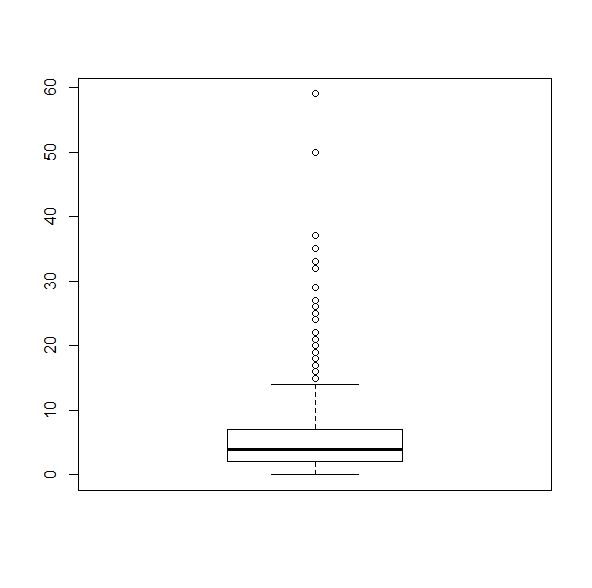
Boxplot of SB projectionsThis makes it as plain as possible that any player projected for more than about 15 SB is, quite literally, a statistical outlier.

20/20 Vision

The same idea goes for getting a grasp on multi-category players. Most of us are looking for players who can bring in both HR and SB, but how many of those are really available? Let’s do a quick 2D plot:

plot(steamer$SB, steamer$HR)
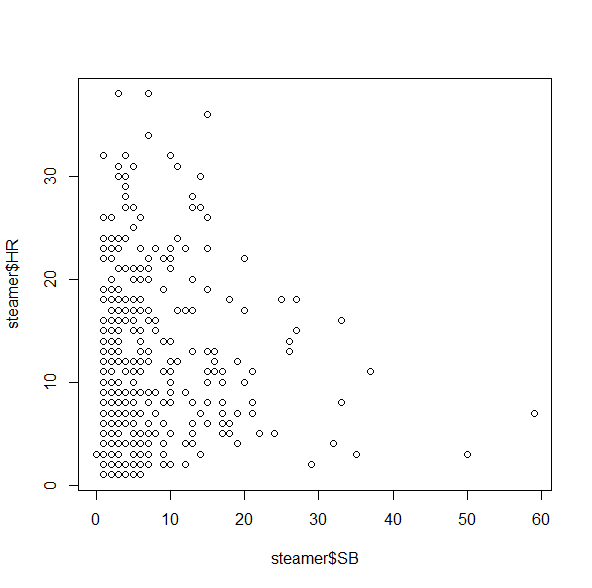
Basic plot of HR vs. SB projectionsThis isn’t bad, but unfortunately it doesn’t give us a good sense of how many players fall into each category, since there’s only one dot for all of the 5 HR/3 SB players, one dot for all the 2 HR/4 SB players, etc. A quick workaround for this is the jitter() command, which moves the points around by tiny increments to get rid of some of the overlap:

plot(jitter(steamer$SB), jitter(steamer$HR))

And, for good measure, let’s add a grid on top:

grid()

Your plot should now look something like (but not exactly like) this:
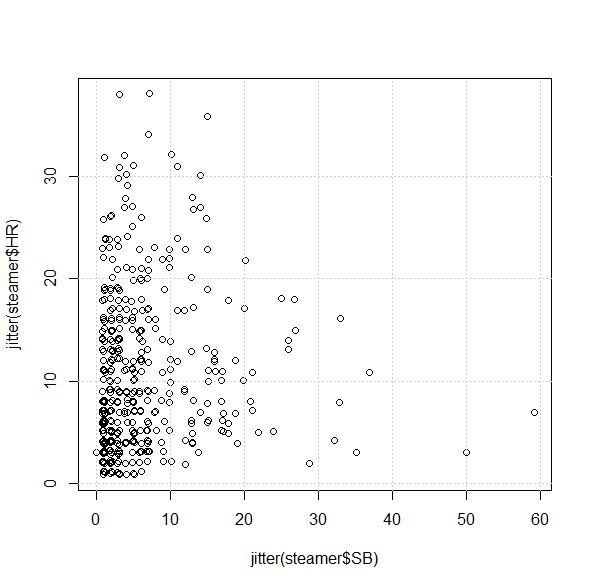
Detailed plot of HR vs. SB projections

From the chart, we can see that it’s not impossible to find players projected for 30/10 or 10/30, but it looks like there’s only one 20/20 guy in Steamer’s projections:

subset(steamer, (SB >= 20 & HR >= 20))

            Name   Team  PA  AB   H X2B X3B HR  R RBI BB  SO HBP SB CS X.1   AVG   OBP   SLG   OPS
40 Carlos Correa Astros 636 571 157  33   3 22 80  82 54 110   4 20 11  NA 0.275 0.339 0.458 0.797

Of course. As if being a 21-year-old SS with plus average wasn’t enough.

Fun With Subsets

Let’s close this out by doing a bit more with subset() — possibly one of R’s most useful tools for our purposes because it’s just so much quicker and more customizable than online tools or Excel.

Say you want to find the prospective “five-category players”; you may have a sense of who some of the candidates are, but you might be surprised by what the numbers actually suggest. How many players, for example, are projected to do better than 10/80/80/10/.275?

subset(steamer, (HR > 10 & SB > 10 & R > 80 & RBI > 80 
 & AVG > .275))

               Name         Team  PA  AB   H X2B X3B HR   R RBI  BB  SO HBP SB CS X.1   AVG   OBP   SLG   OPS
1        Mike Trout       Angels 647 542 166  32   5 36 104 104  90 138   8 15  6  NA 0.307 0.410 0.585 0.995
5  Paul Goldschmidt Diamondbacks 652 543 158  36   2 30  93  93 100 142   3 14  7  NA 0.290 0.401 0.531 0.931
7  Andrew McCutchen      Pirates 653 554 165  34   3 23  88  87  84 123   9 12  6  NA 0.297 0.395 0.496 0.891
25    Manny Machado      Orioles 663 597 170  35   2 27  91  87  53  99   4 14  8  NA 0.285 0.345 0.484 0.829

Fewer than you may expect–which could well make them all the more valuable.

Conclusion

Projections, of course, are just projections, and you shouldn’t take one set — or even a combination of sets — to be a true predictor of what will happen this season. But if you typically look up projections player-by-player, or if you’re disinclined to take in a huge wall of stats at a single glance, looking at the broader trends in individual visualizations can help keep you on the right track as you prep for this fantasy season.

Here*, as always, is the code used for this post. If you have anything else you’d like to see us do with R as the new season comes near — or any suggestions with what you’ve used R for — let us know in the comments!

*download the ZIP and extract the R file.

TechGraphs Report: On Deck Sports and Technology Conference

Earlier this week, NYC’s Bohemian National Hall played host to hundreds of sports executives, entrepreneurs, and others looking to learn about the very latest in sports technology. Since 2013, the On Deck Sports and Technology Conference (organized and presented by SeatGeek) has provided a forum to showcase what products are “on deck” to help fans follow, analyze, and participate in sports.

On Deck has a slight bent towards sports startups, so a decent amount of the conference was geared more towards raising capital, scaling businesses, etc. Still, there were plenty of fascinating talks, panels and interviews for anyone interested in straight sports tech.

Statcast And Beyond

Possibly the most entertaining talk of the day was Joe Inzerillo’s (CTO, MLBAM) update on MLB’s Statcast, which is finally getting its moment in the sun this season. For those who needed a refresher on how Statcast operates, Inzerillo discussed its missile-technology radar system, its stereoscopically-placed cameras, and how these allow each Major League ballpark to track the movements of every player on the field (plus the ball) at any given time.

Once Statcast has this information, as Inzerillo pointed out, it can then provide real-time data on pitch velocity (actual and perceived), player velocity and reaction time, and a horde of other quantitative metrics, plus more advanced data on a 12-second delay, like fielding route efficiency. This data is just inherently cool (as you likely know if you’ve seen a Statcast-enhanced game or highlight on television), but it’s also already being used to both question and confirm existing baseball strategies.

For an example of the latter, Inzerillo looked at the fallacy of sliding into first using Statcast to plot Eric Hosmer’s 1B slide in Game 7 of the last World Series. Hosmer hit a peak speed of 20.9 MPH before sliding and being out by less than a tenth of a second. If he had just kept running, Statcast found, he would have been safe by nearly a foot. Statcast is already getting noticed by clubs, and even players — batters like to talk smack, apparently, over who has the highest exit velocity.

During questions, Inzerillo was slightly cautious about committing to the future of Statcast, but he did mention that minor league stadiums were a natural next step, and that there was plenty of work being done on developing new metrics. Statcast already tracks ‘defensive range’ for fielders, for example, but since a player doesn’t travel the same speed in every direction, there’s a need to find the more amorphous ‘effective defensive range’ and how it changes–such as during defensive shifts.

On the football side of things, Sportradar’s Tom Masterman talked about the NFL’s NGS (Next Gen Stats) platform, which is collecting data on every single game in 2015 to track, analyze, and visualize how players are moving on the field. NGS is already being distributed to clubs, media, and health and safety personnel; the long-term goal is to have X,Y,Z coordinates for every player and official, plus the ball.

Go Bucks

On Deck’s attendees weren’t just league officials and startup managers–the conference started with a live interview of Wes Edens, who became co-owner of the NBA’s Milwaukee Bucks in 2014. Much of the conversation focused on the new Bucks arena, which was being voted on by the Milwaukee city council literally as the interview was ongoing. As it’s currently planned, the presently-unnamed arena will focus heavily on keeping fans digitally connected — giving attendees plenty of WiFi, for example. At the same time, Edens noted, they want to avoid fans using technology to become distracted from the game going on in front of them. (Edens used the phrase “Instagram culture”, specifically, though he noted that he himself has had these sorts of problems before.)

Edens was similarly balanced when the discussion turned to analytics. One of the first things Edens did after buying the Bucks was to build their analytics program — bringing on employees, consultants and even discussing methodologies with other owners. There’s definitely a “golden age” of analytics in basketball going on.  Edens even thinks the NBA will end up surpassing the MLB as the leader in sports technology. But when he was asked about how the players feel?

“It’s a good question,” Edens replied. “There’s definitely lines that can be crossed” with having too much data being made public, at least when it can affect the privacy of the players (such as rest/injury issues).

Edens also briefly discussed the role of the referees and the potential benefits of replay and “the new center across the river“. Could we see yet more referee technology, even an Oculus Rift-type headset for NBA officials, in the future? “Totally possible.”

Era of Mobility

When it came time to look at how fans themselves were interacting with sports, technologically, it became clear that mobile is “it.” In that panel about growing sports startups I mentioned earlier, representatives from SeatGeek, FanDuel and Krossover all praised the importance of the mobile web for their companies–SeatGeek’s rep described it as a “tale of two companies”, pre- and post-mobile, and Krossover’s founder mentioned they’re considering dumping their web app altogether in lieu of just being on smartphones and tablets. When Yahoo Sports’ VP of engineering presented a chart showing their fantasy football traffic from this season’s Week 1, the fraction of non-mobile data was a pretty small sliver at the top.

Yahoo fantasy data graph
Trust me, it’s there.

Even companies you might never expect to get in the mobile game are joining and succeeding. Jeremy Strauser had 20 years of gaming experience at EA Sports and Zynga before joining one of the most loved and enduring brands in the sports industry, Topps. Yep, they’re digital playing cards.

Topps first got into the digital game 4 years ago and how has three top-selling sports card apps, plus a newly launched Star Wars-themed set. Why should you be interested in buying trading cards on your phone? One starting point is the capabilities the digital platform provides — literally hundreds of thousands of different designs, the ability to create all manner of rare and unique cards, etc.

Topps is also rolling out a daily fantasy sports feature (DFS was a major topic of conversation at On Deck) that allows you to compete using the players in your card deck and swapping them in and out in real time as they go up to pitch or bat. It probably doesn’t hurt, either, that they won’t take up space under your bed or get thrown out by your mom when you’re away at college.

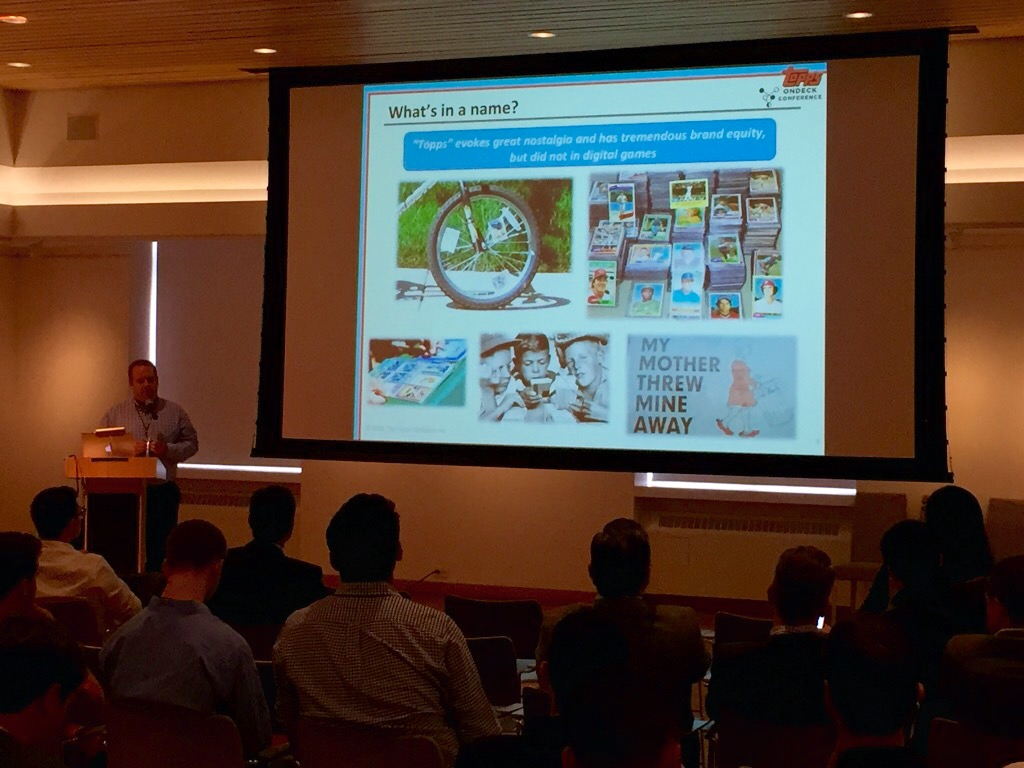
Topps conference talk

Coming To Your Hometown

If you want to look for the next wave of sports technology, though, look to your neighborhood.

Rather than providing new tools or analytics for MLB, the NFL or the NBA, the newest sports apps want to help you participate in sports in your own town. On Deck wrapped up with a “Startup Pitch Contest” a la Shark Tank where teams had four minutes to present their groundbreaking app to a group of judges. The six competitors included:

  • Wooter – a search engine for finding and joining sports and activities like local rec leagues. Wooter provides profiles for leagues looking to form teams, players looking to join them, and the tools to process payment and set up other logistics.
  • NextPlay – helping youth coaches conduct tryouts and league drafts. For $15/month, instead of taking a stopwatch, a bunch of handwritten notes, and an Excel spreadsheet to put together youth rosters, NextPlay handles all the data collection and analytics itself. Their beta has been used by “a couple hundred organizations” and over 10,000 athletes.
  • ScoreStream – filling a gap in local journalism by crowdsourcing reports on high school sports.

With a really impressive presentation, broad coverage (10,300 HS games covered last week alone) and the #1 iOS app for high school sports, I really thought Scorestream would walk away with the prize, but it ended up going to…

  • SidelineSwap, a P2P marketplace for sporting goods. SidelineSwap has over 43,000 registered users who’re interested in trading out sporting gear just collecting dust in their basement or garage. They’re working on building partnerships with youth organizations and promoting used college-branded material, which should play very well with their chief audience of high school students.

On the whole, On Deck was a whirlwind experience for learning about cutting-edge sports tech. This report only covers part of everything I caught there. Watch for further updates and profiles soon!


How to Follow the PGA Championship Online This Week

Golf’s final men’s major championship of the year kicks off today in my home state of Wisconsin at Whistling Straits Golf Course. The main headline revolves around two young starts, Rory McIlroy and Jordan Speith, and their reluctant rivalry coming in to the tail end of the PGA season. Whether you are a fan of those two, other competitors in the field, or just like to follow along with the event, you have multiple options for staying in the know during the tournament.

Watching

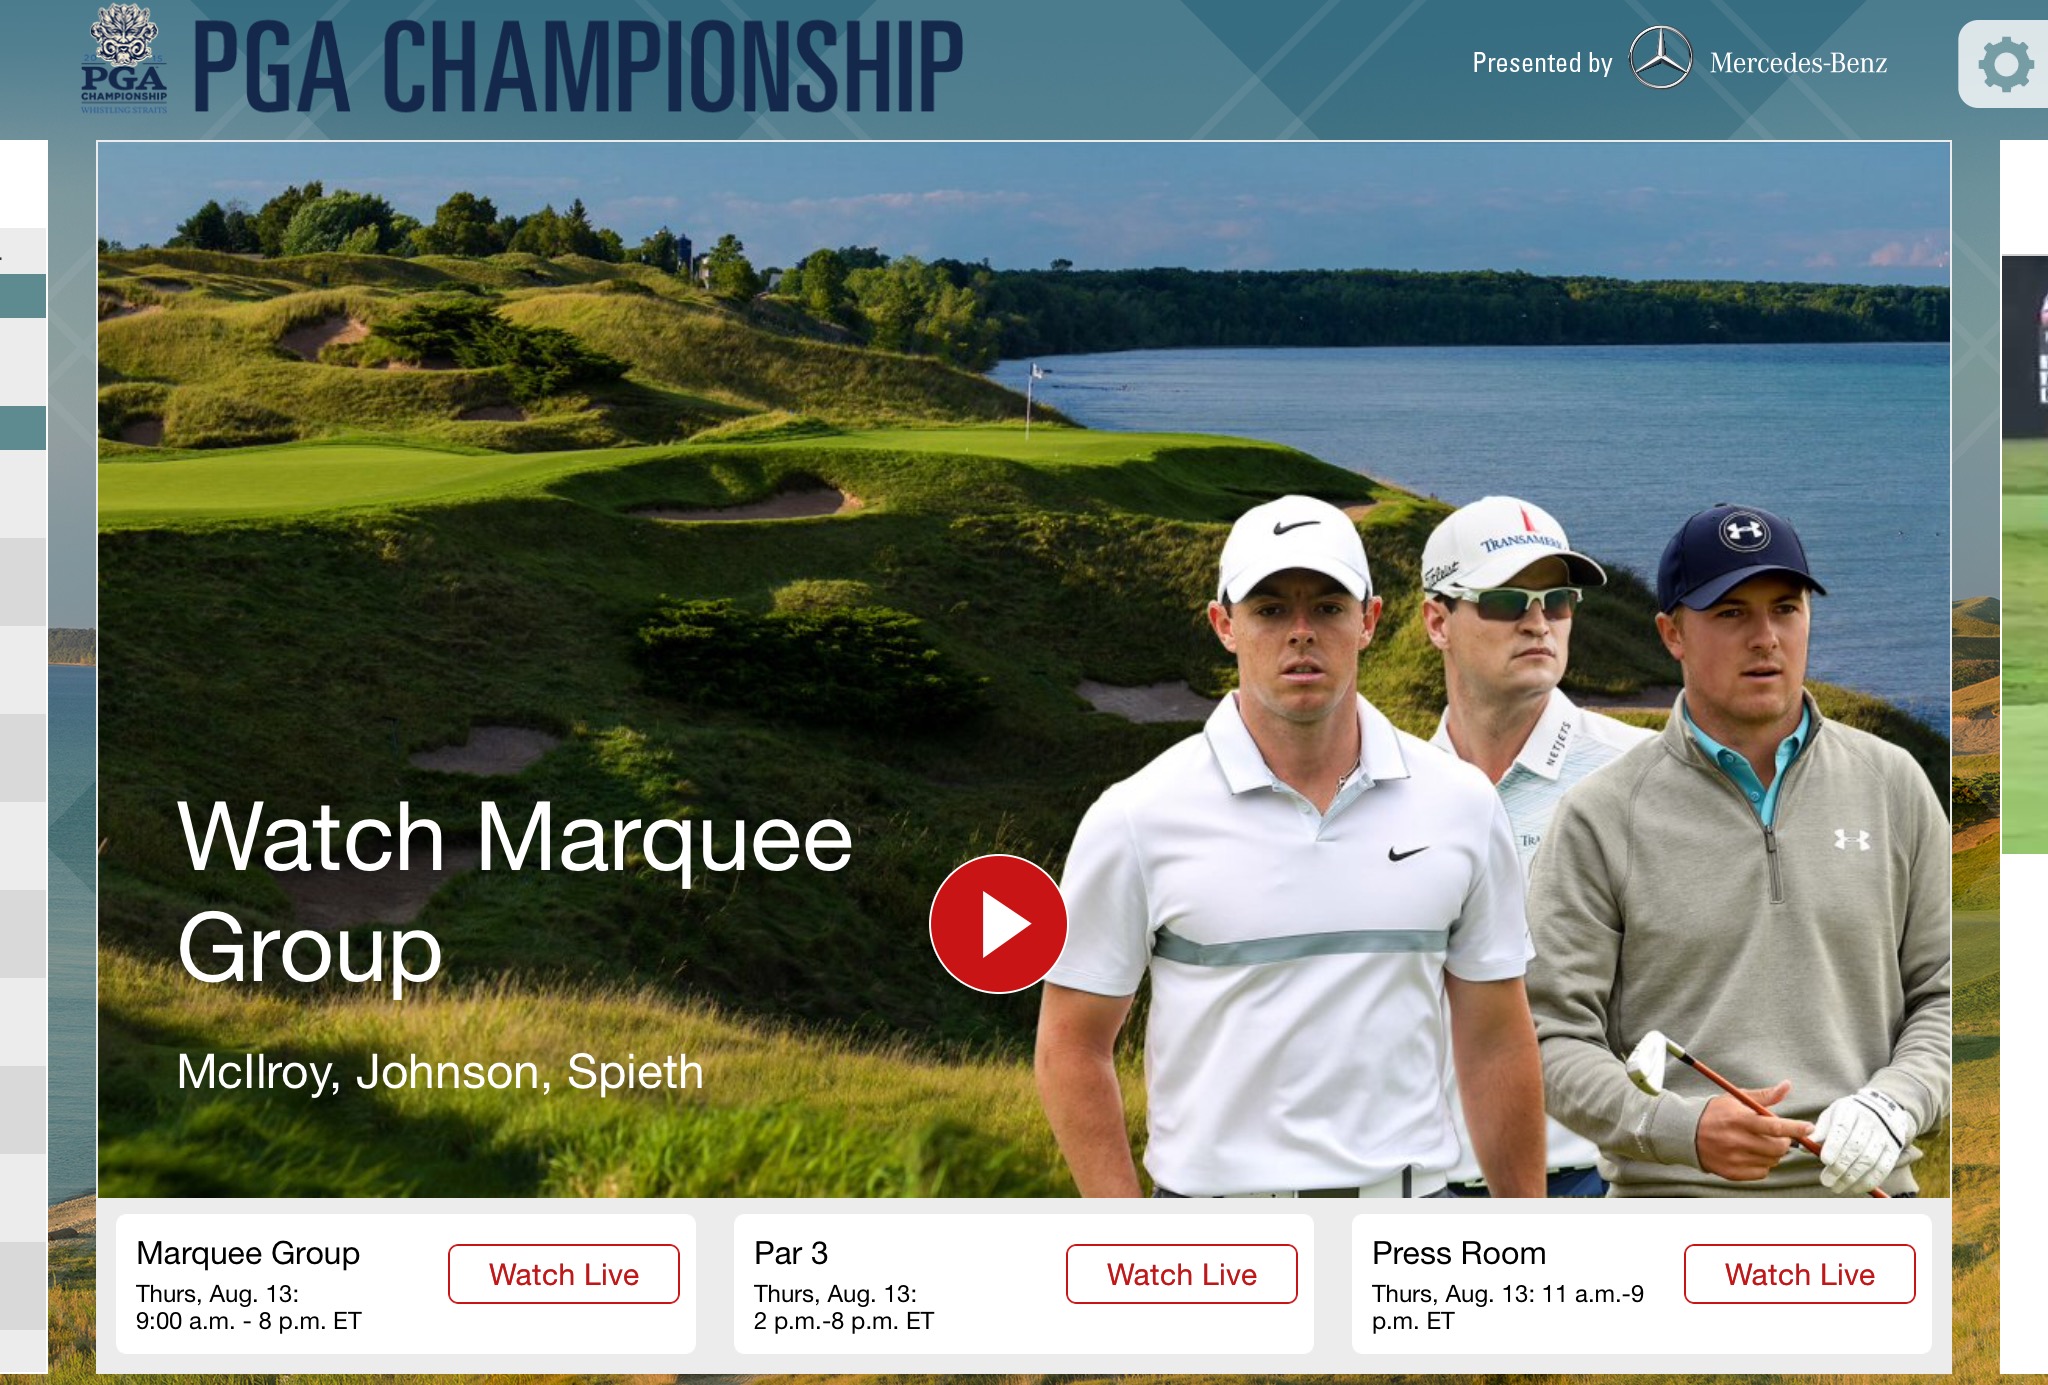
If you plan on being a couch potato all weekend, then a mixture of the TNT network and CBS will have you covered. You can check the tournament’s main page for broadcasting schedules. If you have a cool boss or a strategically-placed cubicle, you can also use PGA.com to stream video on Friday. You will be able to watch the traditional broadcast (when available), or follow a featured group around the course.

The PGA is also offering dedicated apps for both Android and iOS. The apps will allow you watch much of the same offerings as the web site, though it does appear that the app will make you register with an email address. At the time of this writing, I couldn’t find out if cable/satellite credentials are necessary once CBS takes over coverage for the weekend.

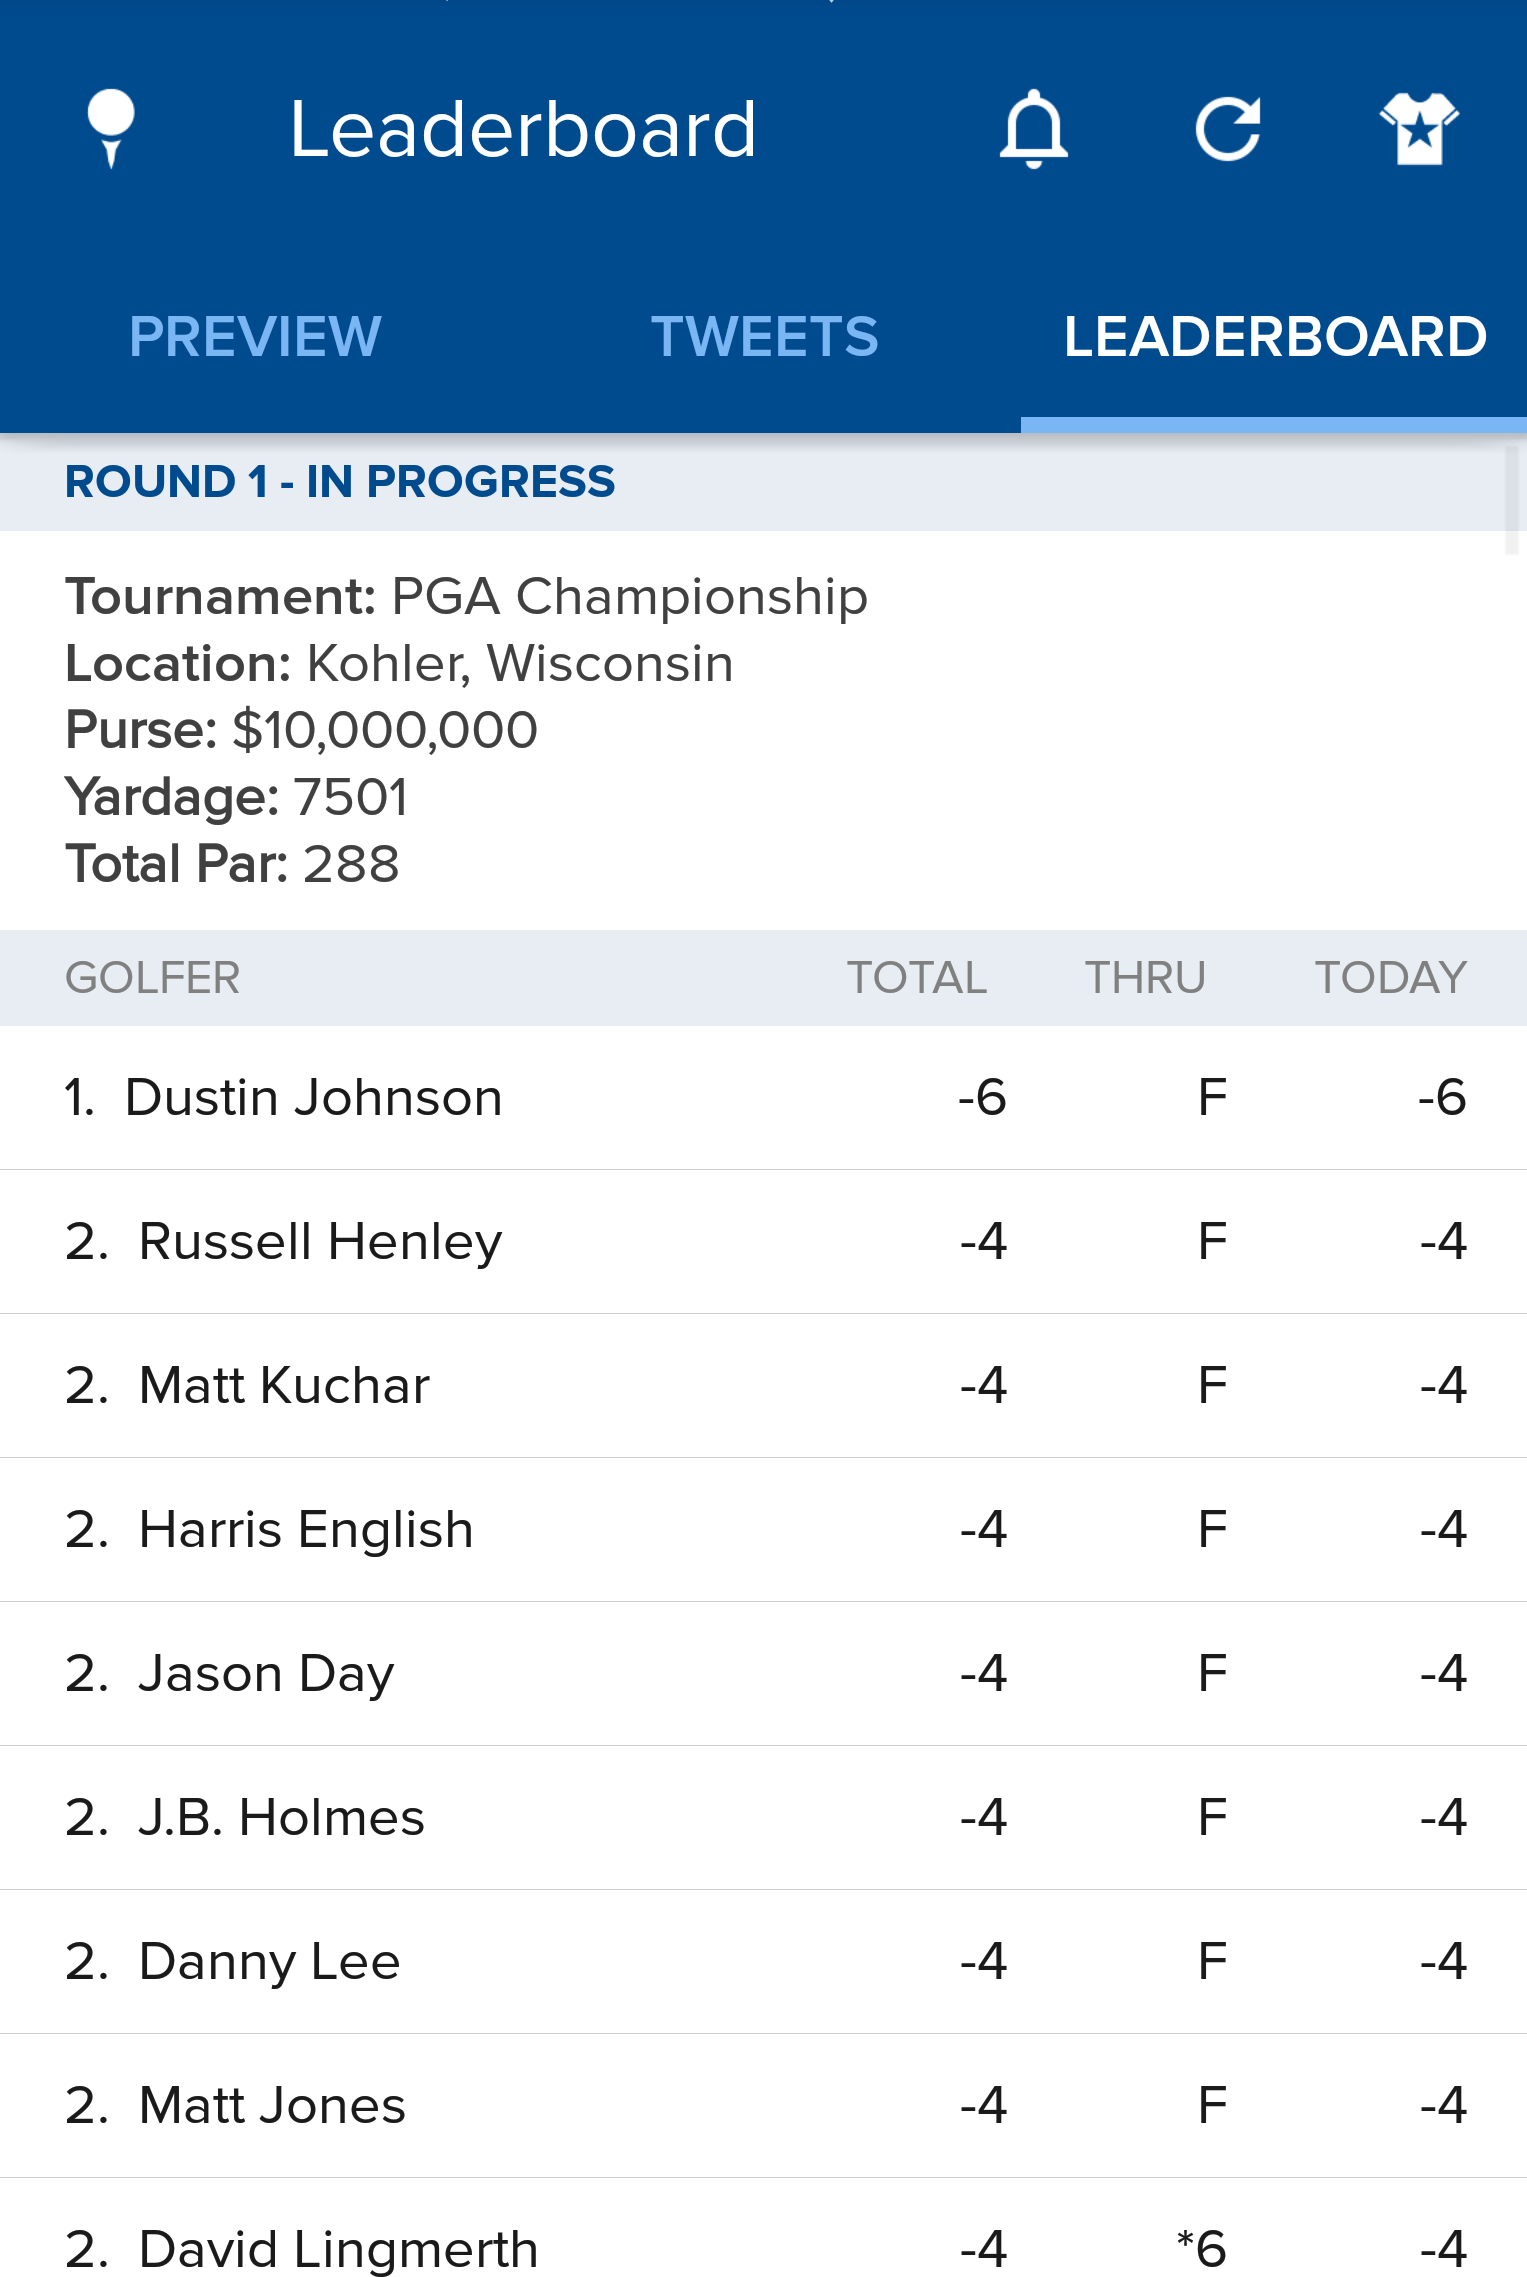
The PGA Championship app for iOS.

Other Ways to Follow Along

If you’ll be out and about and unable to glue yourself to a screen, you will have other options. The aforementioned apps also have leaderboard functionality baked in, and also allow you to select favorite players to follow. You can set up alerts for these players, or for tournament news in general. A helpful buzz might be more convenient than having to pull out your phone every five minutes. The app also cultivates tweets for you, if you wish, so you can see what journalists and other big names in golf are saying about the course and players’ performances.

If you don’t feel like adding yet another app to your growing stable, any sports news app that you currently have should suffice in keeping you up to date. I am a big fan of the CBS Sports app in general, and as that network is covering the tournament, you can bet they’ll be on the ball with updates. The CBS app also provides cultivated tweets from people of import in golf.

The PGA section of the CBS Sports app on Android.

A difficult course coupled with some challenging weather should make for some interesting golf. Whether one of the household names or a more unknown pro makes a run at the Wanamaker Trophy remains to be seen, but armed with the proper tech, you should have no problem following along.


Heart Rate Sensor Assists U.S. Women’s National Team

The United States women’s national team won their third World Cup title this summer in Canada. That same Women’s World Cup, along with this summer’s Under 20 World Cup in New Zealand, marked the first time FIFA allowed players to wear tracking devices during game action. The success of the devices during these events led FIFA to greenlight the use of wearables in future competitions, subject to the approval of individual leagues.

Part of the team’s success was the players’ dedication to the training plans developed by strength and fitness coach Dawn Scott.

“I think it’s a testament to the players that they trusted us and stuck to the program, and did what they needed to even when they had their commitments with their [club] teams,” Scott said in a previous interview.

An earlier Wired article discussed the USWNT’s relationship with Polar Global devices. When reached for comment, Polar Global’s Josh Simonsen confirmed that the players were wearing the H7 heart rate monitor on the pitch, and using M400 GPS watches in training sessions. Simonsen, the company’s national training resource specialist for the U.S., said the Finnish company had worked with Scott and the USWNT since 2010.

“What that gave Dawn was the ability to track speed, distance, and activity of the athlete while they’re away,” Simonsen said. “And they were able to send it her in a much easier environment than the previous models.”

The H7, the heart rate monitor worn during the games, consists of a strap worn across the chest and a small transmitter a few inches wide. The strap contains an electrode that collects the ECG signal from the athlete; after some basic processing, the transmitter then sends out a Bluetooth signal. The system reports heart rate on a per-second basis, using only basic peak-to-peak measurements, which are less susceptible to the kind of movement artifacts you would expect with an athlete wearing the device during competitions.

Polar’s top-of-the-line system, the Team Pro, also includes a GPS and IMU sensor. Switching to Bluetooth Smart also allows the transmitters to communicate directly with a tablet. But Simonsen said the USWNT was still using the older Team2 solution this summer.

“They didn’t want to transition prior to the World Cup,” he said.

The company has a long history with heart rate sensors, having built the first monitor for an athlete in 1977. But it was not until the early 2000s that Polar began developing systems for whole teams, rather than for individuals.

“Essentially the coach would log into the software and each player would have their own page, but they really weren’t able to compare the team as a whole,” Simonsen said. “We couldn’t look at the big picture.”

This functionality would not become available until Polar’s Team2 system was introduced in 2009. Unlike their previous offerings, Team2 allowed coaches to collect and analyze data in much less time. The addition of Bluetooth transmitters also allowed coaches to monitor their players in real time.

“[Team2] was like a 50 percent cut in time that it took to do everything,” Simonsen said. “Everything was exponentially faster.”

The Team2 system is currently used by “about 450 teams” in the U.S., and Simonsen said new coaches are typically surprised by the feedback provided by the data.

“A lot of the time they’re just blown away at how long things were or how hard things truly are,” he said. “Or that their easy day really wasn’t that easy, or that their hard day was a lot harder than they really thought it was.”

Simonsen argues that this experience in the field is what separates Polar Global from the plethora of other companies offering heart rate monitors.

“We created heart rate,” Simonsen said. “And with us using HR from the beginning, accuracy is always our number one thing.”