The UEFA Champions League final will be set Wednesday as Real Madrid and Juventus square off to determine who will face Barcelona in the finals. Barcelona defeated Bayern Munich en route to their finals bid on a 5-3 aggregate score, but it could have easily been 5-4, and a one goal lead — technically two due to the away goals advantage — as a shot in the 39th minute nearly brought a bit of panic to the Barca side.
Bayern’s Robert Lewandowski received a pass near the penalty spot, turned and sent a strike that beat Barca’s keeper, Marc-Andre ter Stegen. From the game feed, as well as the reactions of the Bayern players, it looked as though it may have been a goal.
A different angle shows the entire ball did not cross the goal line, and thus the no goal call turned out to be correct.
While this second angle is no doubt an improvement over the game feed, it is still off-angle and not parallel with the goal line. The Champions League is one of the few leagues in Europe to not have some sort of goal-line technology (GLT) either planned or already in use. From the Dutch league to Italy’s Serie A to England’s Premier League, GLT is something that absolutely needs to be an industry standard.
Just two days ago GLT was the difference in the EPL as Swansea downed Arsenal 1-0 due to a no-goal call being overturned. Reddit user Poet-Laureate, via Gfycat, clearly showed the use of GLT to determine the game.
Both men’s and women’s World Cups as well as numerous domestic leagues have embraced the usage of GLT, though few international leagues have done so. Aside from the UEFA Champions League which pits clubs against each other, national teams in the 2015 Asian Cup nor the 2015 Africa Cup of Nations did not benefit from any form of goal-line technology. Similarly in North and South America the CONCACAF and CONMEBOL respectively have yet to implement GLT in any capacity. One of the reasons behind the lack of GLT is cost, as UEFA President Michel Platini deemed the technology too expensive in 2013, citing a preference to use the money “on youth programs and infrastructure.”
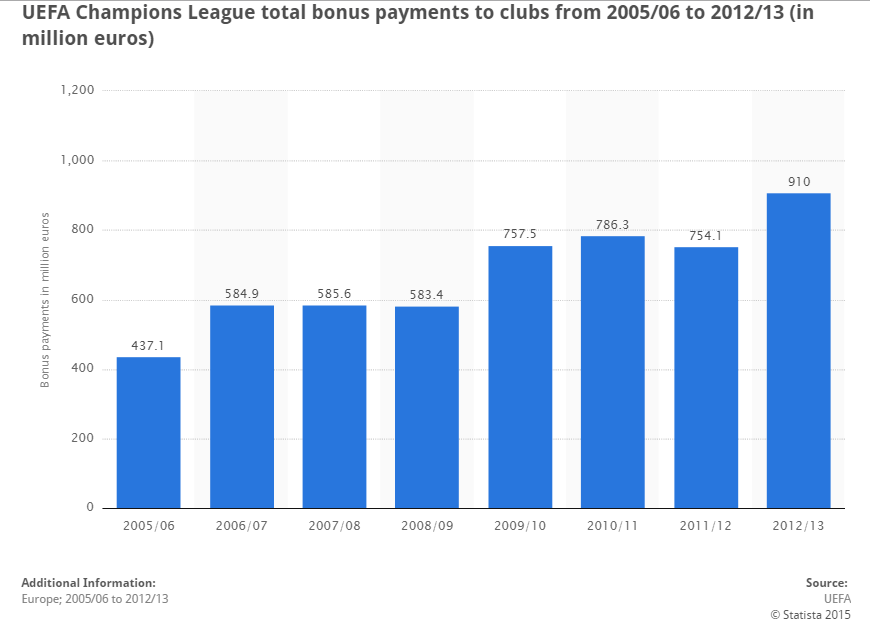
According to Statista, money paid to clubs in the 2012-13 season equated to €910 million.
Given the UEFA distribution model, 75 percent of the total revenue goes to clubs with the remainder being kept by UEFA. Revenue above the €430 million mark will be split at 82 percent going to teams and 18 percent to the league. It’s hard to cry poor with that amount of money being publicly disclosed. Soccer leagues are unfortunately notorious for a number of murky and handshake deals — not to mention outright awful human rights — but not utilizing goal-line technology due to something as easily dismissed as cost is absurd. If the finals game is decided by a questionable goal or no-goal call, then maybe UEFA and other international leagues will stop sitting on their hands.
For those frustrated in the United Kingdom regarding the Sky TV’s Go and Go Extra no longer being watchable on Google Chrome, help has arrived in the form of Slingbox’s M1 now being available throughout Europe. Via press release, Slingbox announced their set-top box system is now being sold for £129.99 or €199.99 and boasts being compatible with every cable and satellite provider and 100 percent channel availability in their M1 video.
While this still requires a cable subscription, Slingbox does not require any monthly fees to watch sports and shows on the go. That their computer and laptop interface is compatible with Chrome (as well as Safari and Firefox) is a major chip in Slingbox’s favor. Sky Go doesn’t cost anything extra for eligible cable subscriptions, however features such as international viewing, downloading or watching downloaded content are limited to the Sky Go Extra package, costing an additional £5 per month. Currently Sky Go and Extra are limited to iOS and Android whereas the M1 works with iOS, Android, Windows Phone and Kindle devices.
Slingbox is looking to fill what appears to be a self-created void created by Sky for many soccer fans throughout the UK. Given Sky — and to a lesser extent BT Sports — dominate the English Premier League broadcasting rights, it’s surprising to see a company refuse service on a web browser. Fans who can’t be in front their televisions could turn to Slingbox for their on-the-go needs. Senior VP and GM of Sling Media Michael Hawkey is counting on that and said of the latest market expansion:
Given its strong reception in the United States, we are excited to introduce the Slingbox M1 into the European market….With a Slingbox M1 that has been completely localised for customers, we’re delivering the most affordable Slingbox packed with the most robust set of features that we believe will significantly expand the mobile TV and video market.
If the M1 sells well enough and Sky finds many subscribers canceling their Sky Go Extra package, perhaps then the message will be clear: keep up to date with the consumer’s demands or you will lose money.
Last year’s Super Bowl being streamed online was a huge move for the big four — NFL, NBA, MLB and NHL — though the other sports have yet to cater to the streaming population. More fringe or niche leagues may be more willing to embrace the available technology as they attempt to grow their brands, or so it would seem within the ranks of the Professional Bull Riders. Last week PBR announced a partnership with the streaming company Flipps to showcase via pay-per-view their Ring of Honor: Unfinished Business event.
Earlier today via press release, Flipps posted additional details about the Ring of Honor stream. Set to take place on May 30, will consist of a three hour live broadcast of the various competitions with riders aiming to take home up to $160,000 in the winner-take-all formats. In order to view the event, a $29.95 price tag is attached, the same price to watch on Dish Network. Flipps CEO, Kosta Jordanov, said of the partnership with PBR:
PBR is the premiere bull riding organization in the world and we are honored to be able to elevate that content to new audiences through the Flipps platform.
Flipps, a free app available on iOS, Android, most SmartTVs and more, offers both free and PPV options for sports highlights, games and matches ranging from the ACC Digital Network to UFC Sports, the Golf Channel and dozens of others. The entertainment isn’t limited to sports coverage, though. Flipps is dedicated to bringing live coverage to their user base, and includes select programming from Showtime, music videos, plus dedicated genres for children and news. The channel selection also includes industry updates and videos from automotive, health and tech sources. With much of their content readily available for free, Flipps’ revenue comes from in-app ads and video ads, though given their impressive lineup, it is understandable. If you happen to be a bull riding fan who has cut the cord, this is mana from streaming heaven. For those who have dropped their cable packages but are not terrible enthusiastic about the PBR, Flipps has enough other options to be well worth a download.
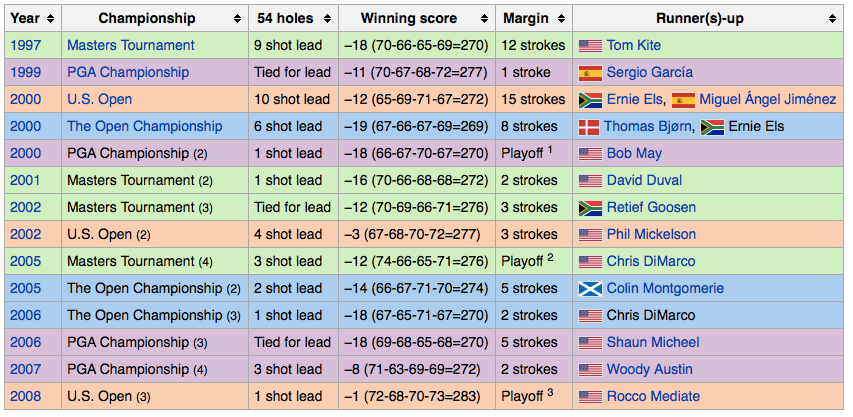
I think it’s safe to say that the Tiger Woods Era is over in golf. Sure, he may find his swing (or a swing), again. We may see him in contention at a major tournament here and there. Hell, he may even win a couple. But personal problems, age, and a slew of injuries has put an end to what can and should be considered one of the most dominating runs in sports history. Although it’s actually been a while, it doesn’t seem that long ago that he was basically unstoppable.
Tiger Woods’ Major championship wins, per Wikipedia
And with the rise of Tiger Woods, golf as a sport saw a rise in popularity. Woods’ presence created must-see TV for even the most casual of golf fans. Woods inspired droves of kids to pick up the sport. EA jumped on the chance to use his likeness in video games. A rising tide lifts all boats, and as Woods lifted trophy after trophy, the PGA Tour’s boat came with.
But now, golf is in trouble. Or at least people think it is. The crash of the real estate market has lead to countless golf course closings. Concerns over environmental sustainability of courses are being raised. Less people are playing, less people are watching. Golf isn’t dead, it’s just less alive than it used to be. I doubt we’ll ever see a talent like Tiger Woods in our lifetime, so it’s safe to assume that golf won’t see another surge in popularity any time soon. But that doesn’t mean they’re not trying. In fact, the PGA Tour is investing big money in technology in hopes to heighten the fan experience.
One of the biggest pushes being made is in the realm of statistics. Baseball fans may be salivating at the thought of what kind of data StatCast can bring to MLB, but the PGA Tour has been utilizing ShotLink technology for some time now. ShotLink brings everything to golf that StatCast promises for baseball. Using a laser system, ShotLink can track hyper-accurate distance and location data for every shot on the course. After these numbers are crunched, essentially any type of stat can be generated and consumed. And the PGA Tour does a magnificent job of this on their own stats page. With a few clicks, fans can find out which player hits the most greens in regulation from 190-200 yards away, who’s best at avoiding three putts from 40 feet away, and who is best at avoiding or finding the rough on the right or left side of the fairway. Baseball lends itself well to statistics due to its individualistic nature. Well, it doesn’t get much more individualistic than golf, and the PGA Tour and ShotLink are showing that seemingly every aspect of the game can be measured, compared, and analyzed.
Another big tech advancement has come with the inclusion of Protracer in TV broadcasts. Through what I can only assume is some version of witchcraft, Protracer hardware and software is able to track a golf ball throughout its flight and graphically display its trajectory. The PGA doesn’t do this for every event, but bigger tournaments — like this past weekend’s Players Championship — utilize the technology. This not only lets viewers see how the path of Sergio Garcia’s 3-wood,
but it can also be combined to show the aggregate of how all players faired on getting their drives to the hair-raising island green of the 17th hole at TPC Sawgrass.
The use of Protracer is not only cool as hell, it appeals to the majority of the PGA’s fans — recreational golfers. This is where the PGA Tour has a huge advantage.
Professional golf is one of those rare sports where fans actually participate in the same sport themselves. Sure football fans might have a backyard game every now and then, and there is certainly no shortage of beer-league softball, but golf is different. We can play with (pretty much) the same equipment as the pros. We can play a lot of the same courses (if we shell out enough dough). While most golf fans can’t match the pros from the tee, all of us know the feeling of sticking an approach shot two feet from the pin or draining a 20-foot putt. Golf fans can do a lot of the things pros can do, just not nearly as often. We know what the trajectory of a perfect drive should look like, and seeing it on our TV screens time after time only solidifies our ideas of just how good these guys are. Football fans know that Aaron Rodgers is good. Golf fans know first hand just how stupid-hard a good golf swing is to make.
With accurate and in-depth metrics, we can know exactly how much better than us they are. We can see shot trajectories that have us yearning for a better swing of our own. If the PGA Tour has their way, these things will keep us coming back for more and more. No, numbers and shiny graphics won’t bring in the same amount of viewers as Tiger Woods once did. But it might be able to reach fans on a more personal level, which just might rekindle or intensify some viewers’ interest in the game. Until another Tiger comes along, that’s probably the best the PGA Tour can ask for.
The graphics and data visualization department of the FanGraphs family have received a significant overhaul in recent months, largely due to the majority of the staff utilizing Tableau. Our own Bradley Woodrum wrote up an extensive and easy-to-read guide on how to take advantage of the program and it more than warrants another read thanks to Tableau Premium being available for free.
Via press release, Tableau announced their Public Premium features are now free for everyone. Boasting the ability to chart 10 million rows of data, 10 GB of storage and the option for creators to keep their own work private or public. Director for Tableau Public, Ben Jones had this to say on the topic:
For people around the world, Tableau Public is the go-to place to create and share public data visualizations. Two years ago we expanded Tableau Public’s analytics capabilities from 100,000 rows to a million rows. We’re so excited to be expanding tenfold again, and we can’t wait to see the stories that people will tell and share.
For a first-hand look at what Tableau can show, both Sean Dolinar and Owen Watson at FanGraphs have data visualization skills that far outpace my own. Count on seeing plenty more descriptive charts, interactive tables and beautiful graphics throughout the FanGraphs family, and with the welcome addition of free premium features, perhaps more beautiful and informative Tableaus will pop up on all kinds of sports web sites.
My love of GIFs stemmed from the early reaction shot days, but has since morphed into a variety of topics ranging from bat flips to goals, to, okay, still some reaction shots. The GIF is being phased out across the board as HTML5 and GIFV services are better equipped to handle a longer clip in higher quality, and recently the site Streamable has been popping up on my radar. As an inquisitive nerd, I dove right in.
Right off the bat you’re given the option upload from your computer or via URL. According to Streamable, the clips utilize HTML5, or in the rare case where that is unavailable, Flash. You’re not forced to create an account to view a clip or even to upload one, though in order to browse your own uploads it is encouraged to make a free account.
Unfortunately at this time there is no search or index option for other clips, so if you come across something you really like, you’ll need to favorite it. Say, maybe a clip of Leo Messi stealing Jerome Boateng’s soul, then chipping Manuel Neuer in the opening leg of the UEFA semi-finals.
(Editor’s note: Some Ad-Blocking extensions seem to block these embeds. If you see nothing, disable ad blocking.)
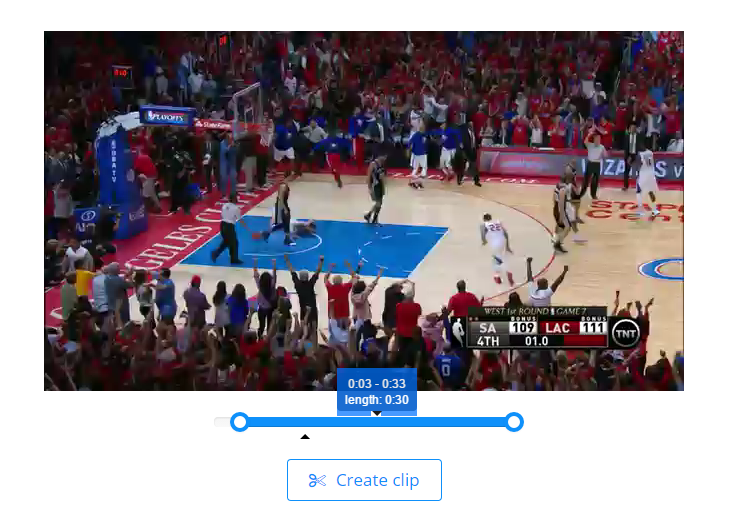
The interface is concise and uncluttered. If you choose to parse down a YouTube clip of a go-ahead shot from Game 7 of an NBA playoff series, it’s very easy. Once you have the URL, simply click “Paste from URL” and allow the clip to upload. As soon as it is in the Streamable editing system, feel free to trim it down from either side as the picture below shows.
After settling on the desired starting and ending points, click create clip and voila, you’re all set.
Streamable offers a fast and simple service and if you’re looking for a GIF-type clip but with sound — it’s the best option short of a full YouTube upload. While I’d certainly love to see a searchable index of clips like Imgur and Gfycat offer, I’ve already began to use Streamable as my go-to option for highlights, even if the highlight is against my favorite baseball team:
I’ve criticized various organizations and even the Federal Aviation Administration for failing to embrace drones and their practical applications around sporting events, but I may be lowering my pitchfork now. The FAA posted a trio of press releases that seem to speak of them relaxing their stance on drones.
The first presser was the announcement of an iOS app (with an Android version on the way) called B4UFLY. The app aims to let controllers of unmanned aircraft systems (UAS or more commonly called drones) where it is legal for them to fly. It will have a straightforward “clear” or “not clear” flight availability for current locations as well as the option to search for other areas for future planning. There are preview screenshots of the app in the second press release here. Of note is a pre-flight checklist as well as indicators for special flight rules around specific areas such as Washington D.C. Within the first release, FAA Administrator Michael Huerta spoke on the app and its goal:
We want to make sure hobbyists and modelers know where it is and isn’t okay to fly. While there are other apps that provide model aircraft enthusiast with various types of data, we believe B4UFLY has the most user-friendly interface and the most up-to-date information.
The third item of news from the FAA was an announcement of a joint programs with CNN for news gathering in urban areas, drone manufacturer PrecisionHawk for crop analysis and monitoring and BNSF Railroad to help examine tracks and overall rail infrastructure. None of these partnerships directly affect the average sports fan, but that the government as well as different companies are at least willing to explore new uses for drone technology is worth celebrating. We may not be able to watch a soccer match in the way a polo match could be utilized, but I am just happy to see things shift from mere conversations and potential turn into policy and implementation.
This is a really simple trick that I think a lot of people will never need, but a few people will love forever. It’s this problem:
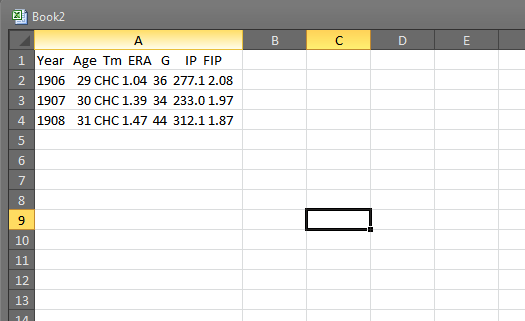
Year   Age  Tm  ERA   G     IP  FIP
1906    29 CHC 1.04  36  277.1 2.08
1907    30 CHC 1.39  34  233.0 1.97
1908    31 CHC 1.47  44  312.1 1.87
Here’s Mordecai Brown’s 1906 through 1908 stats from Baseball-Reference. But some nimcompoop has pasted them as pre-formatted values. Paste this biz into Excel and you get something like this:
This is very unhelpful data.
Well, you’re in luck. Because there’s a super easy way to make this into legit data. Go to the appropriately-named “Data” tab and you’ll find the “Text to Columns” function:
Hello there, handsome!
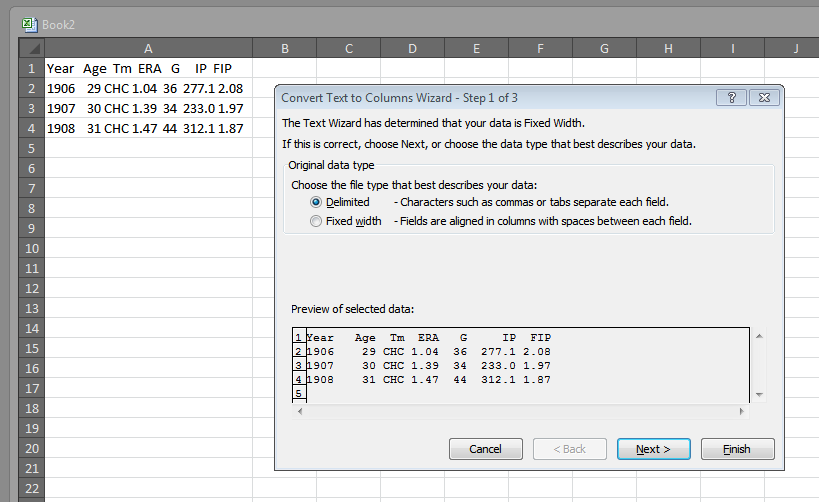
With the data selected, click on this “Text to Columns” button. A pop up window will then prompt you whether you want to treat the text as “Fixed width” or “Delimited.” These concepts are weird-sounding, but actually quite simple:
Fixed-width: The data has spaces inserted into it so that it visually lines up. When you’re pasting from pre-formatted text, this is almost always the right choice.
Delimited: This is text that has special characters within it to help signify the differences between columns. So, if you’re pasting something from a CSV file (a file that uses commas between each data point), then delimited would be the right choice. You can also use delimited if there are spaces between data points — and this can be very helpful when translating a list not intended for spreadsheet use into a spreadsheet.
For this instance, let’s use Delimited to see what happens:
Highlight the text and then open the conversion wizard.
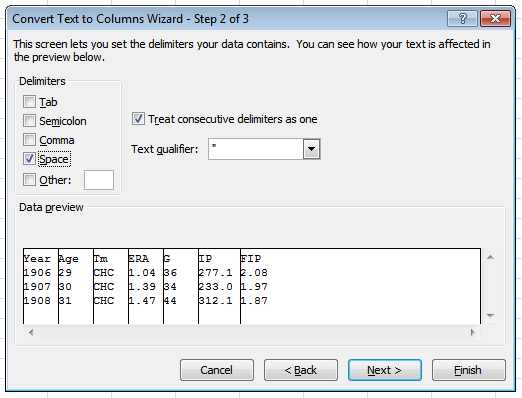
Step 2 asks us what our delimiters are. We can choose one of the usual delimiters (like tabs and commas) or we can use spaces or even insert our own characters (this can be usual for when, say, we scrape data off a Korean baseball site and special Korean characters divide the columns).
With “Tab” selected, you’ll probably notice the data in the preview box doesn’t change — as in, there are no vertical lines indicating the creation of new columns. If you click the “Space” box though, you should see something like this:
Hey! Look! New columns!
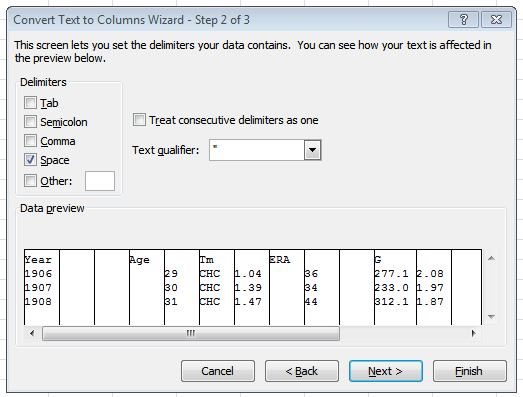
Note the check next to “Treat consecutive delimiters as one.” That is important, because without it, we end up with a lot of columns we don’t need:
Yup, that’s too many columns.
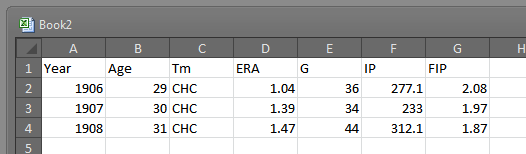
In the third step, we have the option to change the data formats and choose an alternative location for the new separated data to appear — both of which are handy — but in general, our work his here is done. Hit “Finish.”
That should give us something like:
Now the data is separated into unique columns. Note how Excel automatically identified the numbers as numerical despite originating within a text string.
So, the alternative to delimited data is fixed-width. Let’s go Pro on this thing and used the fixed-width setting. But this time, I’m going to use data from my Scoresheet league. I encourage any other Scoresheet users to play along with their own data.
I really like Scoresheet. It is one of the very few fantasy baseball sites to include defense. In fact, it might be the only one. But it has problem. The site’s interface was designed by DARPA to fend off the Soviets, or at least that’s what it feels like:
The 1980s called, and they want to warn us about a time-fissure in the land-line system of the 1980s that allows them to communicate with the future. They also browsed our internet, saw the Scoresheet interface, and they want their design principles back.
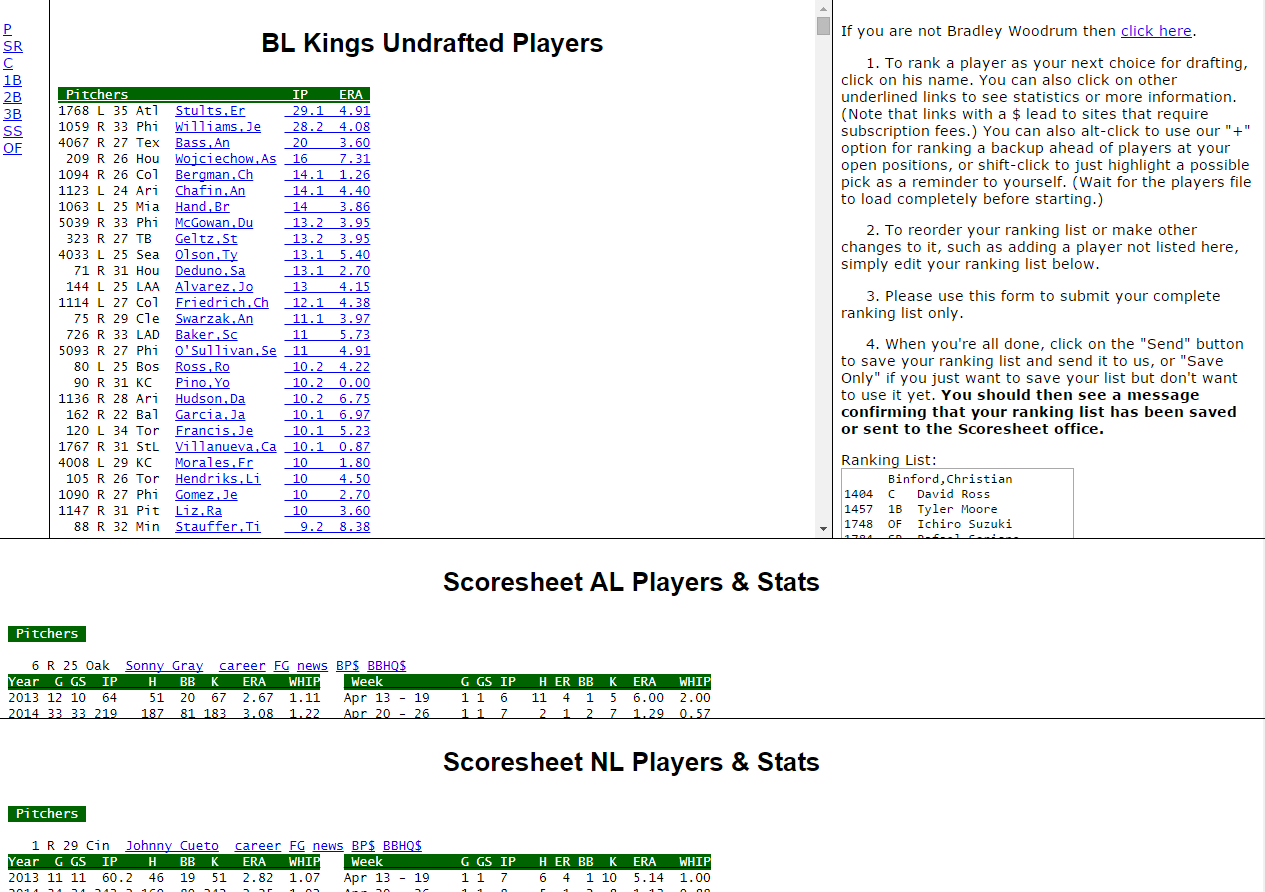
So, here’s my undrafted players list (and before you league-mates start thinking you’ve got a peak at my undrafted players list, just know: I’m no longer in the market for a second catcher or extra bat, so ogle all you want). In the middle, big frame, I have a list of players organized first by position and then by playing time accrued (i.e. their real world stats). But what I want to do is combine this data with, say, some projection data like the FanGraphs Depth Charts leaderboard.
But in order to match these undrafted player with the FanGraphs DC projections, I need to first suss out the names of the players. I can achieve that through scraping the numbers of available players here in this undrafted screen and then combine them with the Scoresheet master roster (downloadable here).
For those keeping track at home, I’m combining data like this:
The undrafted list will connect to the master roster which will connect to the FanGraphs projections which will connect to my league championship.
We need to scrape the data from the undrafted list. This amounts to clicking in the middle frame of that previous screen, pressing CTRL+A (select all) and then CTRL+C (copy).
Remember, you only need the stuff in the middle frame.
Pasting that into Excel gets something like this (note, I deliberately pasted using source formatting):
It’s so beautiful!
First, we can get rid of those top two rows. Really don’t need them. BUT DON’T DELETE THAT THIRD ROW. We need that.
Let’s go ahead and split our data. Select the entirety of Column A (just click the “A” at the top). Then run our handy converter (Data > Text to Columns). This time, let’s go with Fixed Width (though, once again, we could probably make it work with either).
We see reach a screen like this:
We can click and drag the arrows to change where the columns start. We can also click on spaces in the ruler section to create a new column break.
The key here is that the numbers on the far left are isolated into their own column. It’s fine that the word “Pitchers” is getting sliced into multiple columns; we don’t really need it anyway.
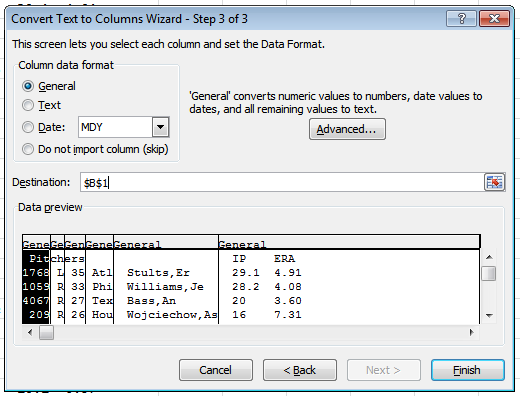
Scrolling down the preview panel, I can confirm that all the numbers are indeed isolated into the far left column. Now I’m going to actually use the Step 3 of the conversion wizard.
In Step 3, I can choose an alternative destination for the conversion. I want to do this. So I’m going to change the “Destination” section to the next available column — in other words, change it from $A$1 to $B$1:
We can change the destination by either typing in a new one or just clicking on where we want the first row and first column to start.
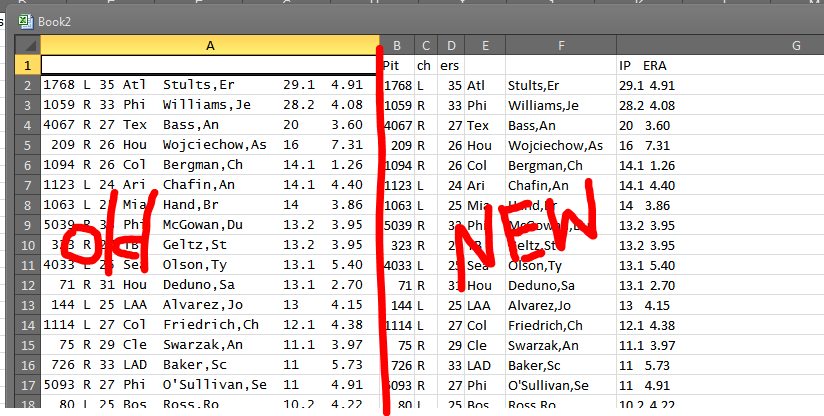
Great! Now I’ve got my data separated out:
Now I’ve got my original data (on the left) sitting next to my split data (on the right).
Now I want to get rid of all the blank or white-font lines. These are leftovers from the column titles on the Scoresheet website. First I select all the data (CTRL+A and then CTRL+A again to select everything), and then I sort by the first column.
Sorting Z to A, I find — midway down the data — this blank spot where white-font titles have gather together:
Let’s get rid of these now useless titles.
After I purge those rows, the data should be clean. Row B should be nothing but numbers. Beautiful, delicious numbers.
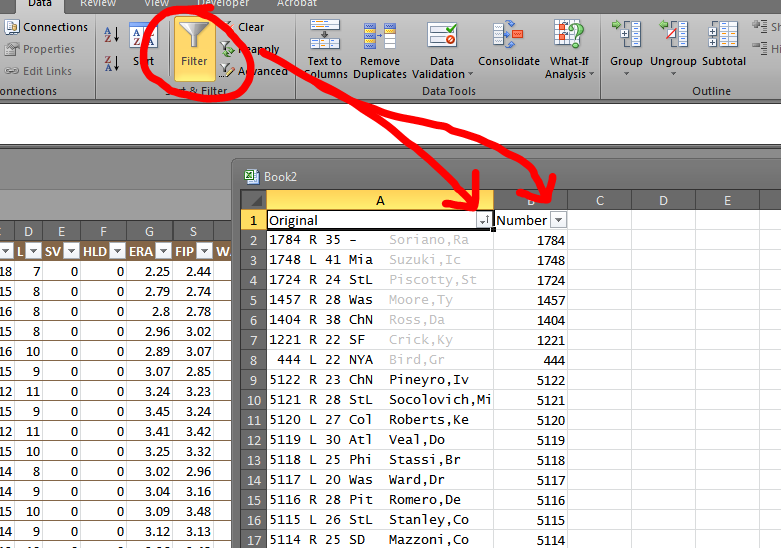
So let’s go back to the top and add a title row. I really only need the first two columns for this, so I’m going to name them Original and Number and then delete the rest. Then I’m going — once again in the “Data” tab — add filters (Data > Filter). If you had any one of the data cells selected (i.e. not a blank cell selected), then Excel should add a neat little pair of gray arrows at the top like such:
We can now sort this data in more fun ways.
You may also notice my data is already sorted in the preceding image (note the little up arrow inside the gray box). But this data is clearly not sorted numerically or alphabetically — No. 444 Greg Bird is near the top. It is sorted, however, by color.
See how the items with gray fonts are now all in the top together? These are players already drafted or selected for my queue. This is why we need the original formatting in the first pasting job.
So now I’ve got my numbers isolated. Using VLOOKUP (or INDEX and MATCH), matching these players to their full names should be a cinch (also, a CONCATENATE formula will help join the first and last names of the players). And with first and last names, we can do one more VLOOKUP / INDEX-MATCH to join them to their projections.
The net result, with some formatting and careful data pollination, can look something like this:
WONDERFUL, SEXY DATA!
Now the real trick will be for me to find a way to hide this article from the guys in my league.
As TechGraphs readers commented, it didn’t take much digging to find a free stream of the Pacquiao/Mayweather fight from the weekend, despite HBO and Showtime’s legal jabs. And for the first time on a grand level, sports is dealing with pegged-leged and eye-patched mauraders in the form of social media live streams via Periscope and Meerkat.
The Los Angeles Timesreported that Top Rank Inc. will seek legal action against individuals that it determines illegally streamed the fight and the companies that provided the platforms for them to do so.
“We’ll have to pursue any people who are allowing people to distribute something that is behind a proprietary wall,” DuBoef told the Times. “We’ll have to challenge those technology companies that are facilitating it and we’re going to have to take a legal position against them.”
Twitter, which owns Periscope, contends it respected intellectual property rights and disabled “dozens” of illegal streams of the fight. But a tweet from Twitter’s Dick Costolo, chief executive, seems to have discredited the company’s sincerity in fighting the piracy.
Christina Warren, a writer at Mashable, shared her experience exploring the different Periscope streams. It’s a great read which you should check out for yourself.
Tapping into a few streams, it was quickly apparent that some were just standard Periscopes of friends at a fight-night party, while others were focused intently on television sets or computer screens playing the fight in real time.
The number of streams was almost overwhelming. Some Periscopers were shooting in portrait mode (as is standard for Periscope), while others were shooting in landscape to capture more of a TV screen.
Some streams featured commentary from parties and shots of friends; others focused almost completely on the fight itself. Some streams were in crowded rooms, other in almost empty homes.
Based on the map on Periscope, I saw streams from all over the world. There was even a stream of the fight from a police department in Africa. The Pacquiao-Mayweather fight was a very global story, and this was evident from the Periscope streams.
Warren noted that it did seem someone was shutting down the streams. If a specific stream received too many favorites, it’d get shut down. But Warren would just find another. She said the stream she watched half the fight in had more than 10,000 people at one point. In an interview at TechCrunch Disrupt NY, Periscope co-founder and CEO Kayvon Beykpour layed out his team’s direct work with the content providers to shut down streams. Bekypour said he took down 30 of the 66 requests, with the others already having stopped streaming on their own. He said they are brainstorming with content partners on ways to better handle piracy.
TechGraphs has been at the forefront of reporting how these apps could affect sports. In March, our own David Temple opined as to possible ways these mobile apps could affect sports broadcasts, namely with streams live from an event or game. A day before the fight, my cohort David Wiers touched on the Meerkat Android app release and wrote:
These are urky broadcasting rights waters we’ve waded into. From takedown notices, muted streams on Twitch.tv due to music rights to being wary of narcs taking you down in person for an illegally stream boxing match, the gap between producers and end-users appears to be widening.
Shortly after Wiers posted his piece, news came out that the PGA Tour revoked a reporter’s credentials for the rest of the season after she streamed a practice round – which no one owns broadcast rights to. The NHL has banned used of the apps and warned reporters not to use them.
It’s one thing for big boxing, the UFC or the WWE to fight these live streams. Their business model depends on pay-per-view buys, and while Warren and others that watched these social media live streams likely weren’t going to buy the fight anyway, it is a legitimate concern that a percentage of anticipated revenue could soon be slashed. It’s a completely different other thing for leagues and content distributors to overreact to what amounts to a second-screen social experience for most.
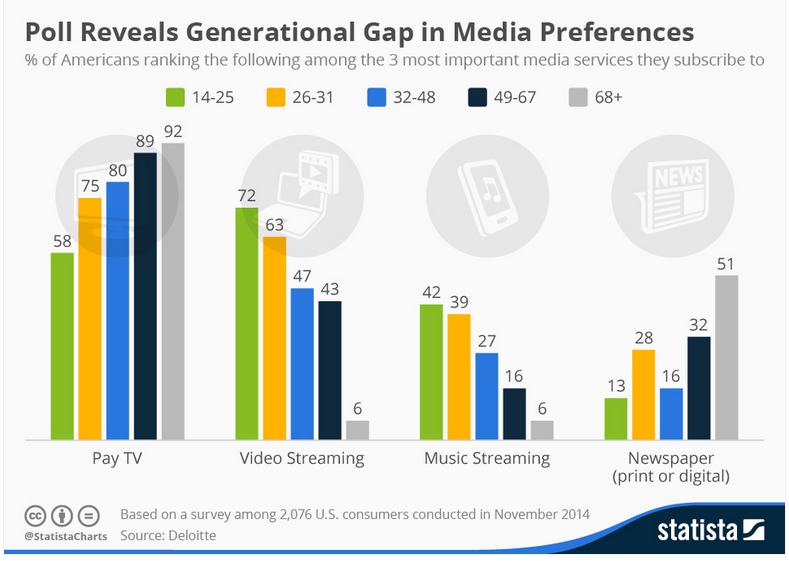
Media consumption, like most things, can be broken down into various age demographics. While the brackets tend to have somewhat arbitrary numbers attached to them — does turning 26 years old really change the preferred method of watching your favorite TV shows? — they can serve as a platform for observation. With thanks to Statista and Deloitte, the gap between paid cable subscriptions and streaming services, among other things, for those in the United States can be clearly shown.
It comes as no real surprise to see the two younger age groups consume the least amount of television while also nabbing the top two spots in video streaming. Somewhat surprising is to see the leading millennials 26-31 age group absorbing more newspaper, be it digital or print, than their older 32-48 counterparts. With large number of online and subscriptions available, plus the Washington Post’s agreement with Kindle customers, perhaps the leading millennial group has come back around in a cyclical trend of newspaper reading.
The percentage of the different aged people who are content with their current cable TV subscription is closely tied with age. The youngest three groups are the least satisfied, reporting at most 55% saying they haven’t at least considered cutting the cord.
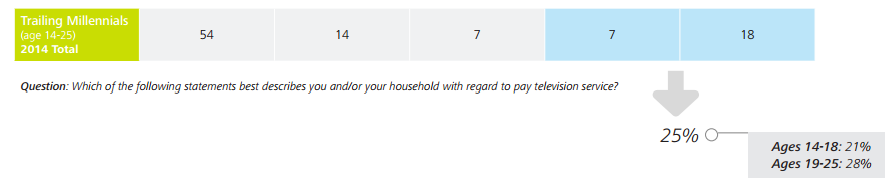
With no shortage of streaming or screencasting options — despite AppleTV’s recent insistence on requiring a cable package for CBS Sports, USA and NBC Sports — the number of current and potential cord cutters has increased over the years, particularly in the younger crowds. Already 25% of the polled age-14 through 25 group hasn’t paid for TV in over a year or have ended their cable subscription within 12 months. Within the age group another trend emerges as 28% of 19-25 year olds versus 21% of 14-18 year olds are calling themselves cord cutters.
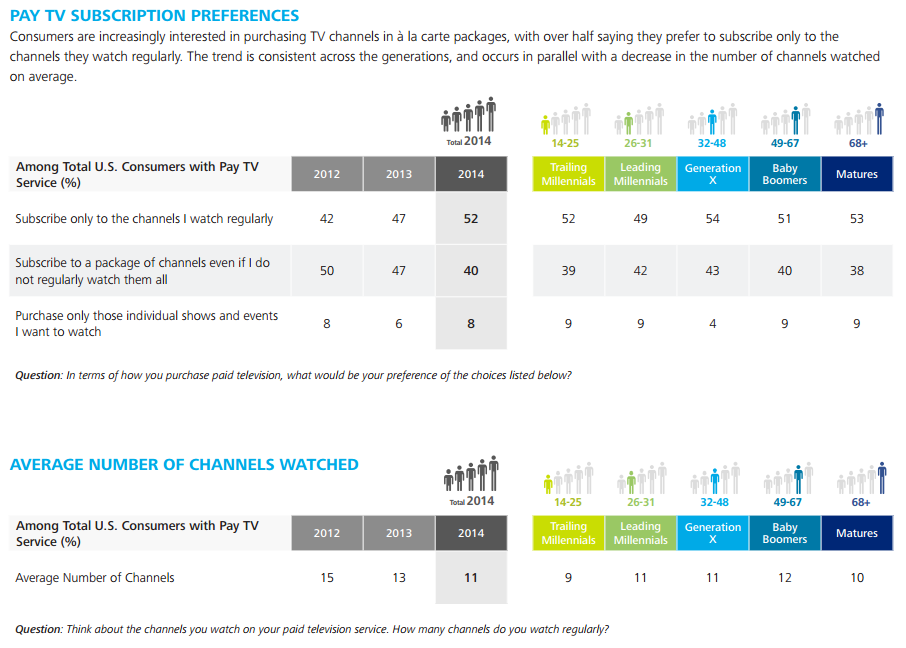
As the overall demand for TV changes, so does the desire for the way TV packages are sold. For the first time in the three year data set, more than 50% of the polled desire the ability to choose individual channels to watch. A three year decrease in the average number of channels watched further highlights the growing calls for an a la carte system. Canada is already developing a government mandate for cable companies to allow customers to choose individual channels after an initial package, though no legislative traction has gained ground in the U.S. yet.
The numbers represent a clear trend in increased subscription based services and a desire to either ditch cable TV altogether or give it a serious overhaul in programming options. The people are applying pressure to big cable with their wallets as companies lose money with every person severing their TV packages. Still, and with apologies to Bon Jovi, at this point it feels like we’re livin’ on a prayer rather than being halfway there.