While there are some mobile options to be found out there, when it comes to console gaming, there are only a couple series that allows players the full soccer experience. FIFA 15, this year’s iteration of the long running soccer game, has not only undergone a facelift via improvements to the graphics, but also added new leagues, clubs, moves, celebrations and probably most importantly, possession dribbling has been tightened up, as have goalkeepers.
New ball handling and possession additions have brought more goals and more excitement to the game, however it has made 1v1 defending all but impossible. The control and agility moves, such as new cutting and sharper stopping, has wreaked havoc on my old way of defending the ball more than marking the man. Developers at EA have countered this somewhat by adding the new defending feature called “shoulder barge.” It’s pretty straight forward way of defending the attacking player while he is dribbling. You can use a defender to nudge him off of the ball to gain possession and stop the opponent’s attack. Use it too much and you’ll get called for a foul, however it is an immensely important addition. Without it I’d be giving up goals more often than usual. In my very first go around of FIFA 15, I got blasted 6-2 by Manchester City. In my defense I play as QPR — Go Hoops! — but I was blown off the pitch by City’s precision attack.
Another way EA has attempted to offset the vicious attacks that will be brought to you by the new offensive moves is by retooling the goalie AI. Whether or not they come charging off their line to stop a breakaway or go for a ball punch rather than an attempted catch on a corner kick makes all the difference in the world. Watching your goalkeeper give up a cheap goal near post or get chipped after being late coming off his line is mostly a thing of the past. I’ve had several (what I would call) beautiful build ups only to be swatted away by a keeper who I swore I had beat in the upper 90°.
It would be hard to call me a fan of FIFA as an organization — check out this Last Week Tonight piece for a brief reason why, (warning: language) — however their game has now been out for a week and I’m yet to put anything else into my Xbox. Often franchise games get labeled as a simple “re-skins of last year” and while FIFA 15 hasn’t changed any core aspects, the new version doesn’t feel like the same old song ‘n dance.
Speaking of songs and dances, this year’s FIFA has added a ton of new ways to make the game more involved. The all new lineup of goal celebrations may seem like a small detail to some, but don’t count me among that crowd. From classics like the dead fish to new additions such as Eto’o and his old man routine, the celebrations have are incredibly fun. The added “Dynamic Match Presentation” sports unique fan and team reactions including certain post-goal antics that can get 10 men involved.
FIFA 15’s league and club pool has grown as well; for the first time you’re allowed to play as any club in the Turkish Super Lig. A total of 33 various leagues and their clubs are available to pick from, plus 47 national teams. The developers have added enough new options and improved graphics, stadiums and offensive game-play enough to keep casual fans interested. For more die hard type fans such as myself, it was never a question of if I’d get FIFA 15, just how much I would like it. Considering the new attack options and higher frequency of goals, I’m more than happy to recommend this game to anyone.
GoPro, the popular rugged-camera maker, has come to an agreement with the NHL to use the mountable cameras to create a point-of-view look for fans in NHL promos and game broadcasts. According to AdWeek, around a dozen NHL players were outfitted with GoPro cameras during a recent media tour. With cameras on their helmets, jerseys and masks, GoPro filmed the players doing various acts of shooting, skating, and puck handling. The video will be mainly used for promotional material, but some is expected to be cut in to various broadcasts on NBC, Rogers Network, and the NHL Network.
Plenty of hockey-related material shot with GoPros can be found on YouTube, but not of it has to do with the NHL — the best of the best — as of yet. Affixing the cameras to top-tier players will give fans one of the closest approximations available as to what it’s like to play in an NHL game. The footage can provide not only a totally new point of view, but a better realization of just how fast the game can be.
GoPro cameras were made for this kind of thing. Getting their start as the camera of record for extreme sports, they have branched into almost any field imaginable. While people are using GoPros for anything these days, they got their start in sports. It is almost slightly curious as to why it has taken this long for this kind of partnership to flourish. Nevertheless, it makes perfect sense, and should give a more in-depth look at the sport while perhaps even drawing in a few new ones.
If written words aren’t really your jam, then check out this fast-paced, edge-of-the-seat Tableau Public high-speed thriller of a film I made. For bonus points, listen for my cat in the background:
Ask yourself:
• Do I want to use data as evidence for a claim?
• Do I want to present my data in way other than a table?
• Do I want the user to be able to interact with my data?
If the answers to these questions are “yes,” then I cannot more highly recommend using the free program Tableau Public for creating a visualization for your data. Of course, the answer to these questions should not always be yes. Sometimes a contingency table is sufficient, and sometimes all you need is an Excel graph (which does not allow for user interaction). The temptation we have to resist is thinking: Well, Tableau makes it pretty and interactive, so let’s use Tableau every time.
I have used tables, GIFs, word diagrams, and interactive tables to communicate data-driven ideas, but nothing has been more fantastic — or easier to learn — than Tableau Public. The first thing you’ll need is not the program, but a question. If you don’t have a question, then you don’t need Tableau. Good questions lead to good articles and good Tableaus, but if you just want to dump data into a program, then the interest in your product will be limited.
Let’s, together, ask this question: What is the relationship between a team’s hitting and it’s win-loss record?
This is a great and basic baseball question — and it is one we can transmute into other sports easily, if’n baseball isn’t your thing (i.e. What is the relationship between field goal percentage / points per drive / shooting percentage to an NBA / NFL / NHL team’s W-L record?). We start by getting some data. For my baseball questions, I usually grab data from the FanGraphs SQL server (which is proprietary) as well as the FanGraphs Leaderboard.
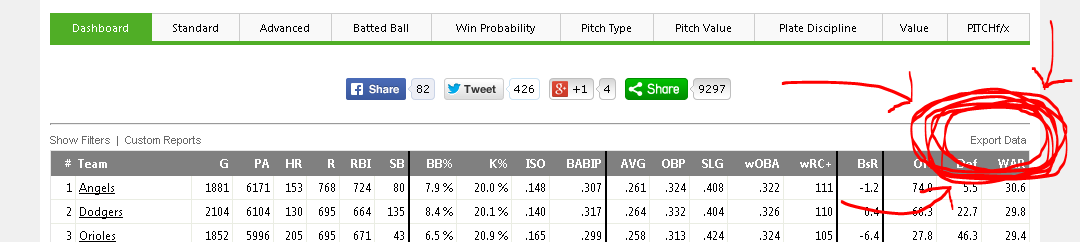
The FanGraphs Leaderboards are magnificent and David Appelman (hi, boss!) has done a double-bang-up job making them highly functional. Sometimes the Sports-Reference Play Index tools answer some of my more unusual questions (like: What is the average team record in 1-run games?), but about 60 to 80 percent of my questions can be answered via the FanGraphs leaderboard (which has wOBA, WAR, wRC+, and PITCHf/x data, making it especially useful for advanced analytics questions). There’s a lot of great things you can do with drop-menus and filters on the FG leaderboards, but for now, let’s just use this handy Export Data link here:
Midway down the page, we find the magic Make a CSV button!
Your browser will now download a .csv file (a comma-separated values file, basically a text document version of an Excel spreadsheet). This is our data.
Now we have a question and we have data. Next we need Tableau Public. Download the appropriate file (Windows or Mac), and then install it. If you are using Linux, you’ll want to download the .exe file and install it using Wine. In order to save and to publish any of your work with Tableau, you will need to set up an account with their cloud server. They will probably send you and email from time to time, but in my experience, it has been the good kinds of email — y’know, actual people asking you what they think of their product.
Let me know in the comments if you are having any trouble at this stage, and I will go into more detail with regards of how to install and set up Tableau Public. I’m assuming most people intimidated by this program are not blocked by the installation process, but the data manipulation side of things, so I’ll focus there.
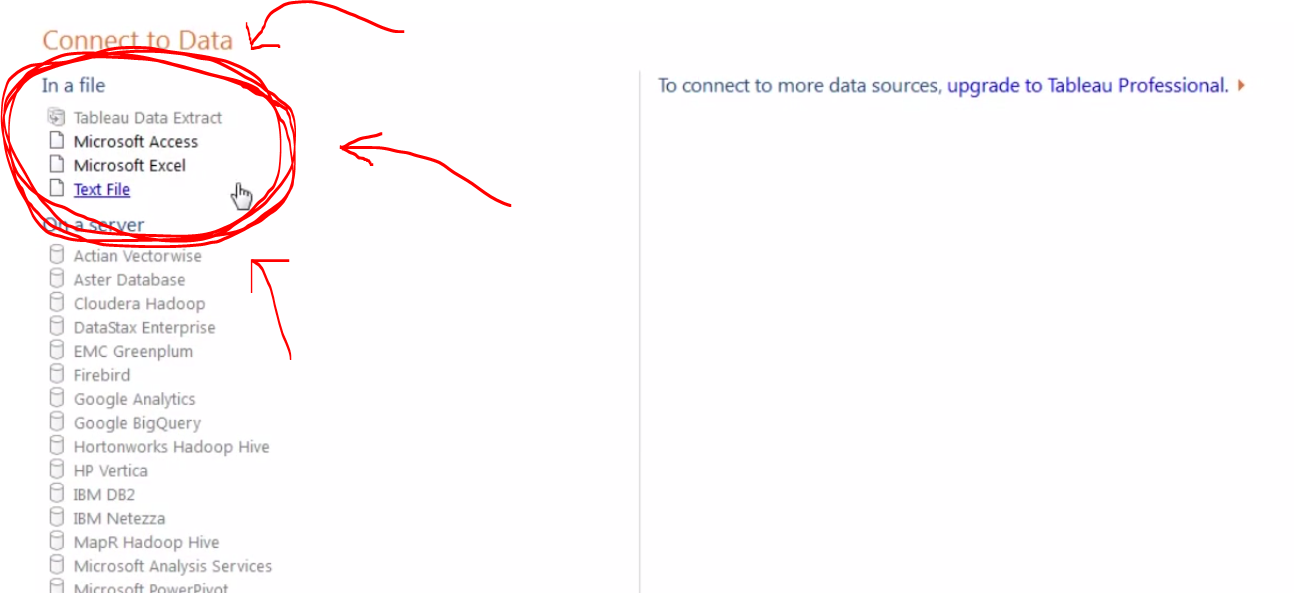
Once you install and open Tableau, you will land on a screen with a big orange button that says “Open Data.” That will take you to this screen, whereupon you can choose your data source:
I typically use Excel files because I will usually want to alter the data a bit before creating a visualization.
We can select our CSV file from our downloads folder, or we can open an Excel file from this screen. Personally, I like dropping the data in Excel first (as seen in the video above) to be sure I’ve got all the right data. Also, Tableau Public does not always love working with CSV files for whatever reason.
Anyway, once we select our data source, a window pops up asking us some specifics about the data. I’d suggest reading the options in here, but for the most part, we can just hit okay and go on living our lives.
With the data loaded, we finally reach Tableau’s sheet view. This is where we will construct charts and graphics, as well as embeddable HTML for blog posts and the like — this, in other words, is where the magic happens.
The Tableau sheet view has a great drag and drop interface.
Our main three areas, at least at first, will be the (1) Measures and Dimensions panel on the left, (2) the Marks panel in the middle, and (3) the Columns and Rows panels across the top. Just dragging and dropping items between these three areas, we can make a whole Tableau document.
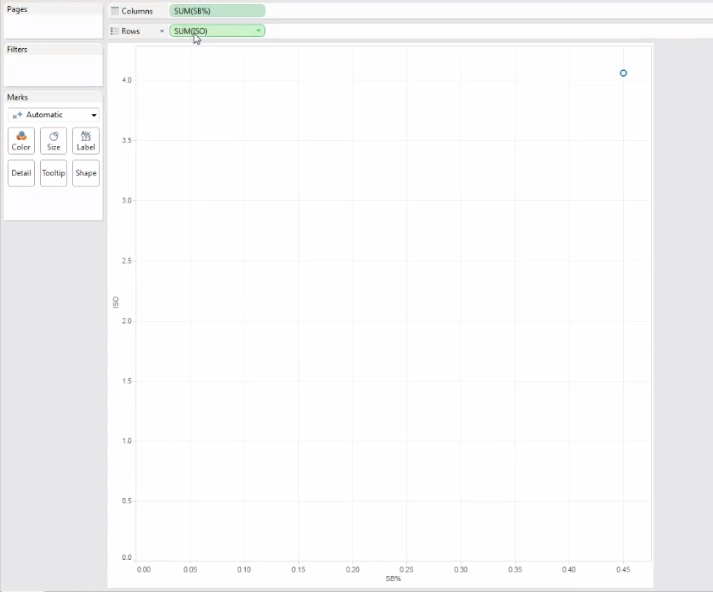
Let’s start by dragging two measures into the columns and rows sections. When we do that, we — disappointingly — get this:
With the data types set to incorrect formats, we can end up with disappointing results. Trial and error is your friend here.
So we obviously didn’t want just a single point in our scatterplot. This is a side effect of wrong data types. Tableau is treating my two inputs (ISO and SB%, which I calculated in Excel as SB/PA) as continuous variables. That means it is summing up all the ISOs and SB-rates in the league, but I want each team to have it’s own individual point in the plot.
By clicking that little green arrow inside my variable icons, I can play around with the data types until I finally have a scatter plot that is scatter plottish.
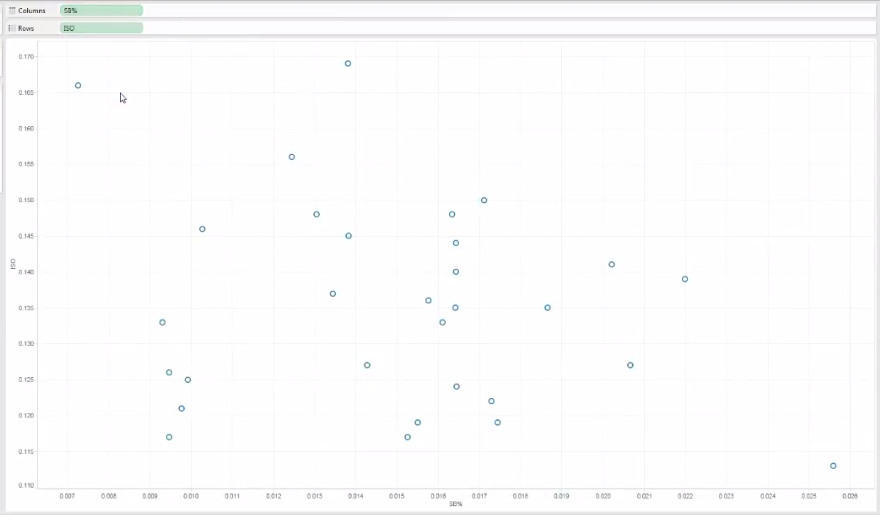
The green arrow inside the variable icon allows us to tweak the data types.
Once we have both variables switched to, in this case, “dimension,” we can then see a proper scatter plot forming:
Scatter plots tend to be my favorite form of data representation, and with Tableau, we can cleanly add more than just two dimensions of information into a scatter plot.
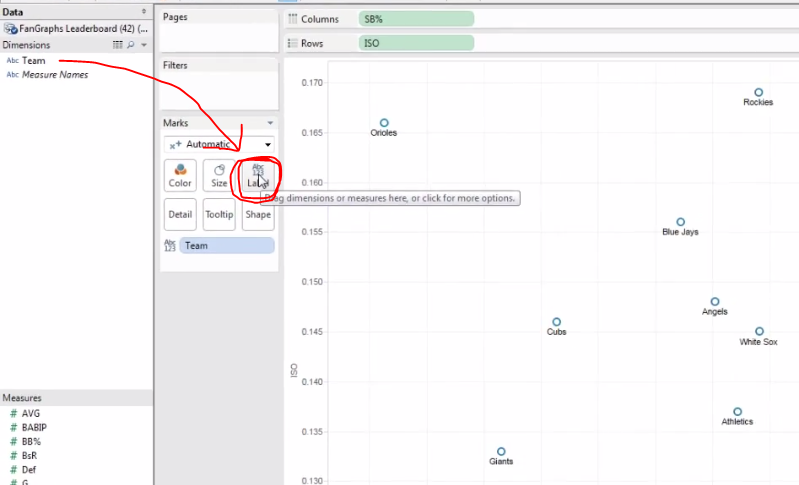
Now we can play around with the presentation — and this is where Tableau really separates itself from Excel. In Excel, if I add labels or colors to my icon, I cannot do so with a third information element. In other words, if I have a plot comparing SB-rate and ISO and then ask Excel to add labels, it’s going to use the Y-axis to automatically populate the label names. That’s no good if I want my dots to represent specific teams.
With Tableau, I can just drag the Teams dimension into the Label square and then Presto-Magnifico, I’ve got my dots labeled appropriately:
Another nifty thing: Tableau does a great job of arranging labels to avoid annoying overlap.
I cannot recommend highly enough the value of playing around with the Marks section. Just drag and drop different Measures and Dimensions into those little rounded squares. As you get more comfortable with these tools, you will start to see the great depth of Tableau’s functionality.
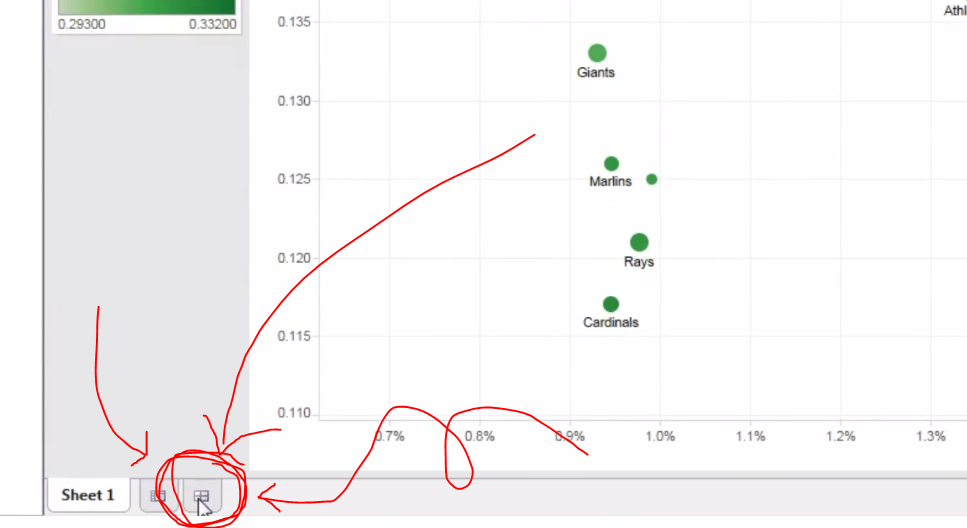
When you have finished getting your plot to where you want it, you’ll want to create a new dashboard. The dashboards are where you can combine multiple graphics (say, a scatter plot and bar graph) as well as organize your keys and color scales and whatnots. To create a new dashboard, click on the new tab icon on the bottom that so happens to look like the Chinese character for field or farm, 田:
Click this little icon to create a new dashboard. You’ll probably want a dashboard if you’re planning on embedding your plot into an HTML blog post.
Like before, everything is click-and-drag in the dashboard view, and if you want any extra formatting options, just right-click something. When you have arranged your dashboard how you like it (and the video above goes into greater detail about this), then you will want to save you project. (Yikes! We waited this long to save?!)
When you save, you are not saving to your hard drive, but Tableau’s cloud. This is both a blessing and a bummer. This means you can access your Tableau biz from all manner of computers — which has proved handy for that last-minute correction — but also means Tableau kinda controls and distributes your work as it so pleases. So, in other words, don’t go around making charts of your friend’s personal cycles on Tableau, lest that kind of info go accidentally public.
Of course, if you’re using Tableau for just sports research, as I do, then you will probably like the extra exposure your hard work gets from, say, appearing on their occasional list of most popular Tableaus (a list I have appeared on a few times, thanks to FanGraphs readership, but would not have otherwise known about had someone not congratulated me). Moreover, the people at Tableau seem genuinely interested in improving their product and have in the past contacted me about questions I had. I imagine if I have serious concerns about my data going public (which, again, why would be using Tableau Public?) then the people Tableau would work with me to find a better fit.
Anyway, once you save your data, a new window will popup. I usually click the “Open in a Web Browser” button at the bottom of the screen and then grab the embed code from the bottom of the page that opens up. I can go into more detail on the embedding process in later articles.
I hope this was helpful! Let me know if you would like more of these or if you feel like I’ve just crushed your soul, wasted your life, or skipped too many steps.
The popular ride-sharing app Lyft has announced a new partnership with Major League Baseball just in time for the playoffs, and is celebrating by offering baseball fans a free ride to or from the park.
Lyft will now be the official rideshare app for MLB for the 2014 Postseason and the entire 2105 season. Details aren’t too plentiful as of now, but Lyft promises “varied, creative promotions across MLB’s industry-leading web and mobile platforms – including ongoing free ride giveaways, special promotions for the playoffs this October, sweepstakes opportunities and more across all clubs’ websites and social media sites.”
Yep, that’s a little vague, to be certain. But while future details might be a little fuzzy, baseball fans can cash in right now on the new collaboration. Lyft is offering one free ride to new customers if they use the promo code HOMERUN when paying for their trip. There is no mention that the ride has to be exclusively for a baseball trip, so fans in a losing city (or a city with no Major League team at all) still should be able to take part in the program.
Fans who use the MLB At Bat app — and especially the MLB At The Ballpark app — should begin to see special promotions and offers from Lyft on their smartphones in 2015, and playoff-ticket holders might be seeing them sooner. Apps like Lyft offer affordable and environmentally-conscious options for sports fans to get to and from a game, and a safe way to get home for those who want to participate in more beverage-heavy ways. MLB is no stranger to business partnerships, and one with direct ties to the fan experience could be a welcome one.
CTE, or Chronic Traumatic Encephalopathy is a fairly hot topic within the NFL lately. The disease is known to cause depression, memory loss and dementia among suffers. CTE is brought on by repeated head trauma, like that which can be found in contact sports like football and hockey. Recently, lawsuits have been filed on behalf of former NFL players against the league, and CTE made the news when it was linked to the suicide of former player Junior Seau. One of the many unfortunate details about CTE is that, currently, it is only detectable post-mortem. However, a recent collaboration between Boston University and Exosome Sciences may help create a test that can detect the disease among living patients.
Earlier this year, Exosome Sciences, Inc. (ESI) announced that they had detected markers that carried tau proteins across the blood-brain barrier and into the bloodstream. One of telltale signs of CTE is an elevated amount of tau proteins in the brain. Now, in partnership with the BU CTE Center, they are looking to develop a reliable test for CTE in living individuals.
The study, called Diagnosing and Evaluating Traumatic Encephalopathy Using Clinical Tests (DETECT), is funded by the National Institute of Health, the National Institute of Neurologic Diseases and Stroke, the National Institute on Aging and the National Institute of Child Health and Human Development.
With the recent findings by ESI and the prestige of the BU CTE Center as a leading researcher of the disease, this partnership brings hope to current sufferers of CTE. Once the disease is detectable in living subjects, drugs and therapies can be developed to help mitigate the effects on sufferers. Once sufferers can be identified, further study can be done into finding the types and severities of head trauma that are most likely to lead to CTE. This collaboration is a big first step in treating, if not eventually curing, this terrible disease.
Sure, there are a lot of jokes to be made about the age of the San Antonio Spurs’ three biggest stars. But the fact of the matter is that a very big part of the Spurs’ recent success — including the 2013/14 NBA Championship — has to do with Tim Duncan, Manu Ginobli, and Tony Parker. Duncan is 38, Ginobili is 37. And while Tony Parker comes in at a spry 32 years of age, all three players’ ages don’t necessarily reflect how much wear and tear basketball has brought on their bodies. While perhaps not on par with a Willie Nelson or Tom Waits, San Antonio’s Big Three have bodies that are perhaps a little older than their actual ages project — at least in basketball terms. The Spurs have been in the playoffs every year since 1997, Duncan’s first season. They’ve gone all the way to the Finals six times. That’s a lot of playoff games to tack onto the normal 82-game schedule, not to mention the international play that all three have been a part of. That much basketball can certainly take its toll on a player. The Spurs know this, and are hoping to enhance their elder players’ health and performance with a new hire they recently announced.
According to MySanAntonio.com, the Spurs have brought on Xavi Schelling, a PhD in Physical Activity, to serve as their Applied Sports Scientist. NBA teams are already able to do a good amount of player tracking with their SportsVu system, and Schelling’s hiring should play nicely into that as San Antonio is notorious for keeping very close eyes on their players’ minutes and usage throughout the NBA season. While details haven’t been announced (are they ever with the Spurs?), it isn’t hard to envision San Antonio going beyond the simple task of tracking game minutes for a player to looking at how they’re being used, how far they’ve run, how long the’ve spent getting banged around in the post, etc. and cross-referencing that with biometric data. This can not only aid in game strategy, but at looking at how hard eight minutes is on Tim Duncan as opposed to Manu Ginobili.
Windows for success are usually small in sports, though the Spurs have managed to keep theirs open for a remarkably long time. Pairing traditional physical training with quantifiable numbers and statistics could help them squeeze the very best out of an aging team that has been dominant in recent years. Players like Duncan, Parker, and Ginobili aren’t going to be around forever in San Antonio, but it looks like the Spurs are trying to make sure those three spend as many productive minutes on the court as possible, while spending the least amount of time in the trainer’s room.
These days it should come as no surprise when a sports team or college build a brand new facility. Be it for games, training, coaching or anything else, a new building or facility can help bring in recruits/free agents. The new Yankee Stadium cost an estimated $1.5 billion. The football facility at the University of Oregon was $68 million. The list goes on and on as when it comes to sports as sometimes spending up front yields long term results.
The continuously-emerging realm of electronic sports, or esports, is no different. Arguably the largest esports league in north america, Major League Gaming (MLG) announced their plans to open a 14,000 square foot state of the art venue in Columbus, Ohio. The building will sport soundproof booths, broadcast platforms for the play-by-play casting and seating for hundreds of spectators. MLG has been hosting live events since 2004. They’ve been around longer than other north american esports league and have added, removed and sometimes re-added various games to maintain strong viewership numbers.
Currently MLG is mostly a console gaming league, however they have included computer games such as StarCraft II (SC2), League of Legends (LoL) and Defense of the Ancients 2 (DotA 2). At the MLG Anaheim event this summer a total of $142,500 was awarded in prize money for various games. In a separate non-MLG event earlier this year, DotA2 set a record for the largest prize pool in esports history, an incredible $10.9 million for The International 4.
This recent news is another sign that esports aren’t going anywhere. With the recent purchase of the streaming platform Twitch.tv by Amazon for $970 million and the popular Minecraft developer Mojang being bought out by Microsoft for $2.5 billion (yes, billion) video games are no longer a child’s hobby or simple entertainment. It’s a business and now we’re seeing the infrastructure being put in place to grow said business. From existing corporate sponsorship to future endeavors like this new facility in Columbus, Ohio, a new era of big business and esports has arrived. Look for the venue to make its debut at the MLG Columbus event spanning October 24-26.
The device emits and receives GPS and accelerometer signals, weighs about 1 ounce and is worn under practice jerseys, tucked into a pouch positioned near the top of the spine. The device emits real-time data on accelerations, decelerations, changes of direction and jumping (height and frequency).
Using the data, which Catapult calls “the world’s first bio-analytics platform,” sports teams monitor daily and weekly leg loads and adjust workouts accordingly. The data also helps quantify the progress of players who are rehabbing from injuries.
There’s so much potential for this in sports, especially in monitoring athletes’ health and rehab. It can also improve the data that’s already out there, such as in baseball with Trackman data. Scouting players and analyzing their play could be made easier with an increase in bioanalytic microchip technology within the next 10 years or so. There’d be much more accurate data — with a smaller margin of error — than there is right now, and that is a huge, huge thing for the future.
Of course, because it’s so recent, it may take a while for more teams to adapt this practice. Also, teams don’t necessarily have the same backing of a Mark Cuban-type like the Mavericks and the Cowboys have. Financial backing could, and would, be a problem for a lot of the small-market teams to incorporate. But, this is a start. There are still a lot of teams out there that don’t have the most advanced analytical technology yet, but it’s slowly being incorporated one way or another. Microchip technology could be the next thing.
If you purchased NHL 15 for the PS4 or Xbox One, you may have noticed an update being pushed to your system. If you were one of the people lamenting some of the missing features — features that appeared in previous games and still exist on the PS3/Xbox 360 versions — consider it an update of some importance.
According to EA Sports, some of those missing features have been patched in to the next-gen versions of the game. Those of you who install the recent update might notice the return of Playoff Mode, allowing an offline, bracket-style competition that supports up to 16 teams. Coach feedback in the Be A Pro mode will allow players to get reports from coaches after every line shift, telling them what they did well and what they need to improve upon.
One of the more perplexing omissions from the original release of the game was the naming of the naming of the Three Stars at the end of the game (only was one player was highlighted in the past). This feature, along with some small improvements to the Hockey Ultimate Team feature is also included in the update.
While not available at the moment, EA also hinted at future content pushes, including Online Team Play and the ability to draft rookies in the Be A GM mode.
GM Connected and EA Sports Hockey League are still nowhere to be seen, and if previous reports turn out to be accurate GM Connected will never appear on NHL 15. The most recent update is a step in the right direction, but it does little to make up for EA Sports’ original and on-going blunder. Fans of some of the deeper features of the game are still left in the dark. Recent backlash has surely spawned the most recent patch on next-gen consoles, and will hopefully be enough to convince the developers to resurrect all the features fans are expecting for next year’s release.
I’ve been fortunate enough to do some traveling recently around the Bay Area. While there, I took the BART system and overheard a conversation unfold that went something like this:
Guy #1: You see (Steph) Curry tear it up in the (basketball) World Cup?
Guy 2: Nah, I don’t have time to follow basketball. Baseball is still going and football just started!
Hard to argue with Guy #2 — it’s hard to justify scrounging every day for every single scrap of news, sports or otherwise. Even on the weekend the 24/7 news cycle makes keeping up difficult. With headlines shifting throughout the day, it is easy to miss what was front page worthy material in the morning by the time noon rolls around.


