It’s starting to become less and less crazy to call the United States digital games market a billion dollar industry. Thankfully, according to SuperData Research, it is estimated at $995 million, a 2% increase over last year. That number represents money going to the developers, and does not account for in-game trading and betting.
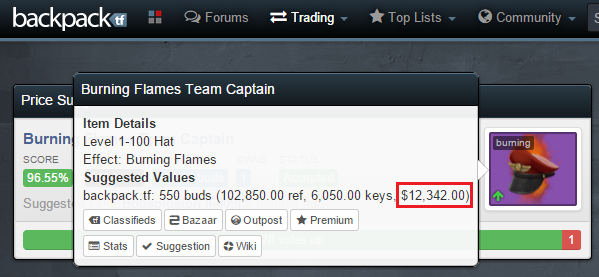
For a taste of how much money trading and in-game economy represents; Yanis Varoufakis, formerly Valve’s chief Team Fortress 2 economist is now the Finance Minister for Greece. Yes, from valuing digital items and pixels to a helping run a country, the economic factor of modern games is not to be understated. A single hat in TF2, the Burning Team Captain, is famous for being a ridiculously priced item, namely about $12,000.
Of the $995 million mentioned, some of that is gathered from monthly subscriptions, mostly from massive multiple games. SuperData Research shows five of the most popular MMO subscription games in the US in the table below.
These subscription-based numbers are missing free-to-play League of Legends and Dota 2, arguably the two biggest multiplayer games in the esports scene. LoL is known for its massive following and Dota 2 is famous for its huge userbase and even bigger prize pool at the yearly tournament known as The International. Esports have become mainstream when the dollars being thrown around rival that of not only major sports franchises, but entire leagues.
When my oldest son was 3 he was obsessed with Cars. While my infant twins napped, he and I would hide in the office to be quiet. I’d do my thing at the computer, and he’d sit next to me in an office chair enjoying some iPhone time. Most of his allotted 20 minutes he’d spend on YouTube, following whatever trail led from my Lightning McQueen or Mater search that got him going.
On one particular day I was writing and chronicled the following:
The Boy, my 3-year-old, is easily influenced by what he sees on television. If something catches his interest, he commits every atom in his being to that one thing. It started with Toy Storyand culminated with us buying him a Jessie hat, which thankfully he’s stopped prancing around the house in.
Then came Cars,and that obsession is still rocking. In fact, he’s sitting on an office chair next to me, watching YouTube on my iPhone. I don’t know what the video is, but I hear an adult male speaking with a slight accent describing a new Carstoy he recently purchased. He’s reading the box, extracting said toy from its container and describing it in detail…and it’s creeping me out.
The rabbit hole that is YouTube is a dangerous thing. According to Childwise, which specializes in children’s research, YouTube is the most popular digital brand between for those 16 and under. That’s ahead of Minecraft, Facebook and Instragram. And because of the way it’s designed, it’s so easy for a child to head down a road flacked by flowers and rainbows with a search so innocent and end up lost in a dark, dense forest of inappropriateness.
One day, while cooking dinner, Jax asked to watch Bambi clips on YouTube. I was convinced this was safe, and he could hide in his room from the twins for a bit before it was time to eat. Other than the mom dying at the beginning, it’s about as innocent as one could get, right? A few days later, he started asking me about zombies. He said Bambi’s mom was a zombie. Whattttt. This kid’s crazy, I thought. After some interrogation, he said he saw it on YouTube. So I searched Google and found what he was talking about.
Facepalm. Thanks for nothing, Cartoon Network.
Google recently relieved, at least a bit, parents everywhere when it released its YouTube Kids app for Android and iOS. As the company blogged, “the app was designed to be easier for kids to use, with a brighter and bigger interface that’s perfect for small thumbs and pudgy fingers.” It also includes features for parents to set up how and for how long the app is used. There’s a timer. We parents love timers. “Sorry, Little Jimmy. The timer says it’s time to be done, not me. I know, I think the timer is a bad, stinky mean guy, too.”
My twins, Ellie the girl and Gray the boy, just turned 4. I sat down with them to explore the sports options on the YouTube Kids app. Here is some of what we found.
“You throw this ball, through the hoop – a basketball” is sung by orange and purple muppet-looking things to the tune of a pop-punk two-minute music video. It’s the most watchable option under the sports search results. And that’s only because I have a huge thing for Marty Feldman.
Ellie: She really liked it, and she likes the orange guy. I guess she likes bushy eyebrows.
Gray: At first, he didn’t like it. He said the guys were weird. At the end of the video he pivoted, said he liked it, and now likes the purple guy. One day I’ll make him watch Young Frankenstein and it’ll blow his mind.
This is one part of a series of videos that utilize magnet letters, plastic eggs and cheap prizes to grab a kid’s attention. The camera isolates on the letters and a faceless man’s hands, which somehow creeps me out after a bit.
Ellie: She stinkin’ loved this and wanted to watch more. She’s interested in letters right now and loved discovering the prize in the egg at the end. I think he had her at the pink wristbands.
Gray: He was indifferent. He watched it, seemed interested, but at the end just wanted to move on.
I despised this one. This is developed by a British company and features sports popular across the pond such as soccer, tennis and cricket. It’s filled with bad rhymes and gross animation. The singing isn’t any good, either. At the end of each sport’s short rhyme, the player becomes a finger puppet. A freaking finger puppet. I’d rather my kids watch zombie cartoons.
Ellie: She liked the girl playing tennis. She had no idea what the point was with the finger puppets.
Gray: Also unimpressed with the finger puppets. He asked what cricket was, and rather than get in to it, I simply told him I had no idea. He was satisfied with that answer.
Maybe I’m just a grumpy, cynical jerk, but the narrator’s voice is unlistenable. I’d rather listen to Fran Drescher read every line of hers from The Nanny. And as my wife would confess, I want to rip out Drescher’s vocal chords, load them on to the next rocket heading to space and pray that it explodes. The script worked for me, as it explains the goal in the sport, and that’s helpful to teach kids just learning about sports.
Ellie: She asked to stop watching after volleyball, 32 seconds in.
Gray: He asked to stop watching much, much earlier.
There’s more of the same after searching “sports” in the app. And while these videos were pretty lame, they held the attention of my preschoolers well enough. And I know I could hand them this app and let them head down a road that won’t lead them to zombies, twerking or Fran Drescher.
It does have Baseball Bugs, so even if it some day does lead to them learning how to assemble a pipe bomb with everyday craft items, the app is still a winner in my book.
The growth of soccer is something we’ve been hearing about since the mid 1990s. Major League Soccer may not have the top tier quality of European leagues just yet, but the quality of play has certainly been on the rise, particularly in the last few seasons. Older stars such as Thierry Henry, Robbie Keane and of course David Beckham have given the MLS a touch of precision it has been lacking. When seeing what these players can do in the MLS, many fans have seemingly sought out higher levels of competition, namely the English Premier League.
Back at the midway point of the EPL season, NBC — who owns broadcasting rights here in the United States — released viewership numbers and they showed an uptick from last season. NBC claimed a 15% jump in TV views and an encouraging 36% increase in streamed games via PC, mobile and tablets. Corroborating the continued rise in soccer’s popularity is the latest Global Web Index report, showing an bump up across the board in EPL watching.
Of the sample of about 40,000 users across 32 different countries, 28% claimed they watched the EPL on television. Another 16% reported streaming the games through their connected devices rather than the traditional TV route.
Unsurprisingly the 16-24 and 25-34 age demographics lead the online viewership numbers, with 19% and 22% respectively streaming their games
Given the time zone differences — a Tottenham fan in San Jose, CA is faced with a seven hour difference or a Bayern fan in NYC still has a five hour difference — it remains a difficult reality for the European leagues to grow here. While some people, myself included, are more than happy to wake up early to watch games, eventually we may reach a point where the casually interested fans are not willing to sacrifice sleep for their soccer fix. Until we reach that point, the rising popularity of soccer, especially the EPL, is a welcome sight.
The PivotTable can be — in the right hands — one of the most powerful and useful tools available to an Excel Wizard. What does a PivotTable do? It reorganizes raw data into malleable tables. This allows us to look at the same data, but through a different lens.
It’s kind of like the difference between a cup of cold froyo in its original form — with a layer of peanuts, a layer of chocolate- and marshmallow-flavored froyo, and a layer of chocolate syrup — and a cup of froyo stirred and mixed up so that the sauce and nuts and yogurt are more integrated. It’s all the same components, the same flavor, but in one form, you can see them more clearly.
Before we can use a PivotTable, we need a question and a dataset that requires a PivotTable. (Throwing a PivotTable at a random problem will do you nothing.) The typical question I have that requires a PivotTable: Who performed best over the last three seasons?
And the question is more complicated than just “let’s add up data from 2012 through 2014.” I want to weight the years 5-4-3, meaning 2014 — being more recent — is 1.25 time more important than 2013, and 2013 is 1.3 times more important than 2012. This is a common weighting that Tom Tango uses a lot, most notably in his Marcel projections.
So let’s use a PivotTable with my Ottoneu fantasy team’s data so I can best predict my targets for the upcoming year. I’m going to head to my Ottoneu league’s home screen and then browse to the “Sortable Stats” section, but just about everything here can be replicated with the FanGraphs leaderboards and WAR instead of fantasy points.
I’m going to next choose to look at split season from 2012 through 2014:
This will return a single line per player per season.
Then we export the data to a CSV:
We can open the resulting CSV with Excel.
Opening that data, we get a bare bones spreadsheet somewhat like this:
Here’s what a spreadsheet looks like.
Then in the Insert section on the top ribbon, choose PivotTable:
Insert > PivotTable
You will then receive a popup window titled “Create PivotTable.” I never use the first section, but will typically leave the second section alone too. Basically, if you want, you can keep the PivotTable in the same sheet/tab, or you can have it create its own new tab. Since PivotTables frequently change shape, I rarely want it anywhere near my raw data because it could accidentally overwrite key stuff.
So hit “OK.”
This will result in something this-ish:
Sometimes the field list will be docked against the side of the spreadsheet. It just depends on what your default or previous settings are.
My original question is: “Who performed the best over the last three years?” That means I want my rows to be each individual player. To do this — and avoid problems like having two players with the same name — I will drag the “playerid” field to the “Row Labels” section:
The “playerid” field as a unique FanGraphs ID for each player. Baseball-Reference, MLBAM, and other sources have their own unique naming systems too, and it’s important to use those when possible.
You should now have something unhelpful looking like this:
Now the rows are each identified by a player’s unique FanGraphs number.
Now we need to add the column headings (“Season”) and the data we want displayed (“FPTS”). Again, this is just a simple drag and drop operation:
This will rearrange the raw data into a more helpful form.
So we end up with something like this:
Now the fantasy points (FPTS) are displayed by player and divided by year.
This is great! But let’s get those names in there now. Drag the “Name” field into the Row Labels sections, adding it just underneath the “playerid” field. This should result in a real messy display where the names appear under the numbers and have completely unnecessary subtotals.
Head to the “PivotTable Tools” and the tab “Design.” Here, we can rearrange the look and feel of the PivotTable. Under Subtotals, choose “Do Not Show Subtotals.” Under “Report Layout,” click “Show in Tabular Form.”
By removing the subtotals and changing to a tabular layout, we can see the player names neatly lined beside the unique playerid numbers.
Now our data is in good shape. We’ve isolated the position player fantasy points by season, and now we just need to create a formula that will weight recent performances in favor of older stats.
The finished PivotTable should look something like this.
So now, in order to jam in my own little formula, I will copy the data (CTRL+A then CTRL+C) and paste the values into a new tab or spreadsheet (so CTRL+V to paste it, then CTRL then V to paste just the values). Now that I’ve got raw numbers organized the way I want them, I will delete the top row (which does nothing for me) and then format the data as a table:
After massaging this data a little bit, we should be ready to create our fun little formula.
First, I’m going to use the filter buttons to get rid of any players who had blank years. Not only do these guys complicate the following math, but they also invariably do not qualify for my question concerning most fantasy points over the preceding three seasons.
After I filter out the “(Blank)” items in the each year column, I should have something like this:
Note how there are no hitters with missing years.
Then I just create a formula that multiplies each year by the appropriate 5-4-3 weight, adds the results, and then divides that sum by the sum of the weights (12). That formula is specifically this:
=([@2014]*5+[@2013]*4+[@2012]*3)/12
NOTE: These previous two steps could go in either order, really.
Then, for fun, I’ll format the final column to look a little nicer, maybe throw in a conditional formatting here or there, and then I’ve got a nifty little tool for for my first year draft. Of course, if I were using this data for a draft in an old league, I would have filtered down to just Free Agents — either in the Sortable Stats page, or within the PivotTable:
The filter tool can allow me to pick which fantasy team I want to look at. In the case of an old league, I’d want to look at “Free Agents.” Obviously though, in a first-year draft, everyone is a Free Agent.
So, after all that work, I finally get my sweet, delicious prize:
Tasty, tasty data.
With a little bit of formula athletics, we can expand this data to look at everyone, even if they have missed a season. This would allow us to allow put rookies and sophomores into the table. But since this is a PivotTable article, I’ll save that for another time.
Winter is finally starting to release its grip on the U.S., but temperatures are still below average and there are several feet of snow on the ground across the northeast. However, golfers can still work on their game without trudging through the snow thanks to simulators like the OptiShot2.
OptiShot is a small company based out of Traverse City, Michigan (2015 snowfall: 89 inches). Their golf simulator allows users to play a full round indoors using every club in their bag*. Even in the summer, the simulator can still come in handy: since there’s no walking or hunting for balls, users can play a full 18 holes in under an hour.
* – While you can use real golf balls with the OptiShot, you might want to consider using their foam practice balls — or no balls — if you’re actually playing inside.
The heart of the OptiShot system is a row of sixteen infrared sensors embedded in a practice mat. The sensors track the club tens of thousands of times per second, sending data via a USB cable to a laptop. There, the OptiShot software computes the speed of the club head, club face angle, and swing path. Of course, the system also computes the trajectory of the shot, projecting it onto three-dimensional replicas of famous courses from around the world. For added realism, the software also includes penalties that limit the range of shots out of the bunker and rough.
But OptiShot CEO Russell Edens says the company’s user base is what sets the OptiShot apart.
“We have the largest user base on the planet,” Edens said. “You can play against other golfers around the world online, and we hold events for people to play against each other.”
To keep its customers happy, OptiShot is constantly digitizing new courses, releasing the Riviera Country Club simulation (pictured above) last month. The device ships with 15 courses, replicas of the courses that host the U.S. Open, PGA Championship, and Ryder Cup; additional course simulations are available for purchase online. OptiShot’s course designers rely on high-resolution photos and detailed three-dimensional data “that maps every contour, dip, and bump” of the famous courses, Edens said.
OptiShot trained its system using launch monitors (like TrackMan) that track a shot’s speed and trajectory, and Edens is proud of the system’s accuracy.
“Frankly, the accuracy of OptiShot for the price point is shocking,” Edens said. “When it come to sidespin, we are often better than most simulators on the market.”
Edens said the touring and teaching professionals OptiShot has worked with to design and test the system were impressed by the system’s ability to capture their game.
“The reaction is nearly always the same,” Edens said. “They hit a shot, nod their head and say, ‘Yup, that’s my shot.'”
FanAngel is a site that, in a just world, wouldn’t exist. The crowdfunding site enables fans to become patrons of NCAA athletes, donating money to persuade said athletes to stay in school, with the site holding the money in escrow until the athlete’s eligibility expires.
While it is true that NCAA athletes from power conferences have been getting the shaft for decades by not being compensated properly for their increasingly valuable labor, crowdfunded donations from fans do nothing to alleviate the exploitative labor conditions under which NCAA athletes operate.
In the event that a FanAngel crowdfunding campaign is successful and the athlete’s NCAA eligibility expires, 80 percent of the money would go to the athlete, 10 percent would go to the athlete’s teammates (nice touch!), and 10 percent would go to a scholarship fund or charity. FanAngel makes money by taking 9 percent of the total amount raised (more on this later). Of course, if the athlete doesn’t stay in school the money is refunded.
Shawn Fotjik, founder of FanAngel, said in an interview with ESPN sports business reporter Darren Rovell, “If you wanted Marcus Mariota to stay in school for his senior year, you could give $20.” I applaud Fotjik on getting good PR from Darren Rovell, but Marcus Mariota is either going #1 or #2 overall in the 2015 NFL Draft and there is no amount of money FanAngel could raise that could keep him in school.
Contributing to a crowdfunding campaign for teenagers who are exceptionally good at big time NCAA sports, and also strangers to the donor, is something I’d assume would be creepy to most well-mannered adults. As has been proven time and time again in my life, I am wrong about this assumption.
Fans of Jarrell Martin, a sophomore forward for the LSU Tigers who, according to DraftExpress.com, is projected to be drafted at the end of the 1st round in the upcoming NBA Draft, have raised over $700 on FanAngels for him to return to LSU for his junior and senior senior seasons, completing his NCAA eligibility. Understanding that FanAngel is a new venture and will need time to scale both users and donations, it still strains credulity to see this ever happening.
For a glimpse of what might be in Fotjik’s future, FanPay, a crowdfunding site which raises donations as graduation gifts for college athletes, has received over 100 cease-and-desist letters from universities and conferences.
Additionally, FanAngel may want to rethink the 9 percent fee they collect for successful campaigns. Other supposedly altruistic crowdfunding donation sites have been taken to task in the past for collecting high fees. One of the worst offenders is Give Forward, which collects 7.9 percent of every donation plus a $0.50 transaction fee. Nine percent is a laughable amount that puts FanAngels in the same exploitative waters they claim they are trying to drain.
If college sports fans suffering from hero worship want to contribute to an NCAA athlete’s cause, they should skip crowdfunding platforms and donate to the National College Players Association (NCPA), which spearheaded the player union movement at Northwestern. Or do what has been done for time immemorial, put some cash in an envelope and make a handoff.
Baseball is 90 percent mental, according to Hall of Famer Yogi Berra. It’s the impetus behind Ned Yost’s Baseball Academics mobile app, which Retain Train developed with the help of the Kansas City Royals manager. Of course, as Berra infamously said, the other half is physical. But other apps can deal with that. Baseball Academics is like a zombie – it just wants your brains.
While Yost is the face of the app, Mike Socha — owner of Retain Train — is the medulla oblongata. He operates the most essential functions to make this whole thing work.
“The goal is to get kids thinking,” Socha said. “There are always going to be mental mistakes. We can’t cure that. But we want to get the kids thinking.
Essentially, the app is a quiz for each defensive position to help players learn which base to throw to. Socha described the app’s system, which is geared towards youth, as a perfect intersection between speed and accuracy, through repetition in a flash card format, to commit scenarios to memory.
Yost described the game to The Kansas City Star as a baseball IQ test. It’s a test that Socha hopes the baseball community will use to evaluate players, along with their stats and physical skills. He said he’s working with Perfect Game and Baseball Factory to have them adopt his Baseball Academic Rating (BAR), which is the score a player earns by playing “official games.”
Users start out on level one, which simply informs where the runners are, how many outs and what inning the game is in. In each game, the user scans the scenarios and touches the base to throw to. As users advance through the training and official games (trainings are required before playing an official game, which is used to calculate a player’s BAR), they level up. Level two adds the score and eventually your positioning is detailed as well. Socha said the game is currently built to level four, but the plan is to reach level seven. However, I wasn’t able to determine what differences the advancing levels offered.
I played five official games as a shortstop on level one before I lost interest. In between each official game are required training games. I aced the official games, as you can see below, and was left wondering where I stood out among all shortstop BARs. But I can’t locate my BAR, or level up. When I asked Socha about advancing to level two, he said 30 official games with a score of 850 or better is needed to move up. And maybe because I’m not a 7-year-old boy anymore, and therefore the game wasn’t designed for a 30-something trying to prove himself as shortstop that could’ve been, I’ve lost interest.
At shortstop on level one, the only real options to throw to are first base or second base. I learned to watch for runners at first, no matter the outs, and throw to second. If no one was on first, always throw to first, because my decision to throw home with a runner at third and less than two outs always resulted in an incorrect answer — likely because I didn’t know the score or if my shortstop was playing back or in at the grass.
I’m interested in the depth of the app as players continue to level up. Socha said there are leader boards and plans for contests. And if I had an ounce of perseverance in me, maybe I’d keep playing to see if I could school all those kid shortstops across the country for top BAR. The app is worthwhile to train baseball players on the fundamentals on where to throw the ball. However, it’d provide a better value if it expanded to include more complex scenarios, such as bunt defense or base running. There are other mental aspects to the game besides where to throw on defense.
The app is free for Android and iOS devices, however the free version only offers training exercises on level one. To jump further in to the experience, a premium membership is required, which costs $10 a month, or $100 for a one year subscription.
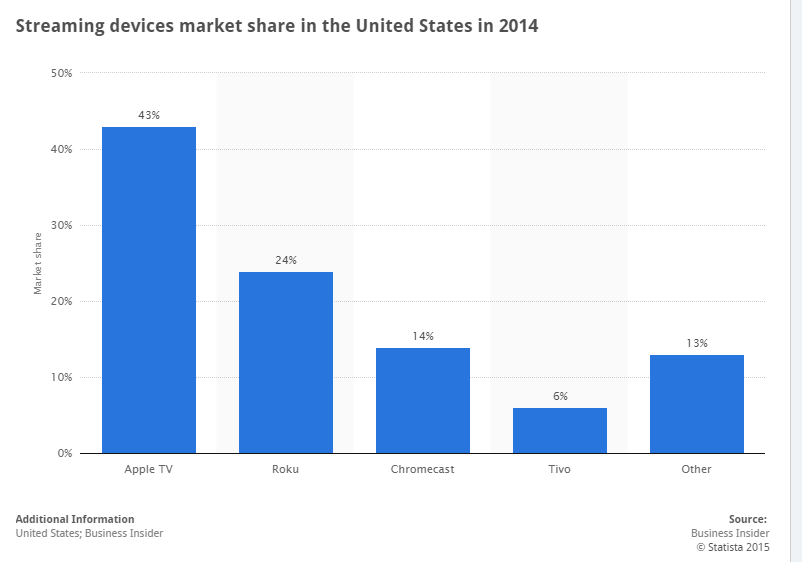
If you’re a fellow cord cutter then no doubt you’ve been just as giddy as myself at the thought of a standalone HBO service — dubbed named HBO Now — ever since it was announced it was in the works. Catching things like Last Week Tonight, Real Sports and more all without paying a premium cable television bill seemed too good to be true. Today HBO may have shaken me out of my dream scenario as today the company announced at an Apple event that the service will debut next month…specifically on Apple TV.
To their credit, HBO Now will be able to be streamed from any web browser, but only with Apple TV will the customer be able to see the premium programming on their televisions. No Roku, Chromecast, Fire TV or other service will be available at launch. CNN senior media correspondent Brian Stelter reported the HBO/Apple exclusive deal will last three months though that is yet to be confirmed by either company. On the hardware side of things, Apple is reducing the price of Apple TV from $99 down to $69,
Statista shows Apple TV holds a clear lead among streaming services, nearly double the share of the second place Roku.
With almost 60% of the streaming market shutout of utilizing HBO Now to its full potential or be forced to make an additional upfront hardware purchase, I’m struggling to maintain my previous enthusiasm.
Apple once again took the tech news industry hostage today, as their Spring Forward event promised to bring new insights into a few of their current products as well as the much anticipated Apple Watch. They announced an HBO partnership with the (now cheaper) Apple TV, an incredibly thin new MacBook, and also previewed ResearchKit — a new way for health professionals to crowd source medical research. But the biggest buzz leading up to the event was Apple’s new wearable, and the folks from Cupertino certainly made that a highlight of the presentation. We don’t know all the specifics yet, but sports fans and fitness nerds should have at least a few things to look forward to.
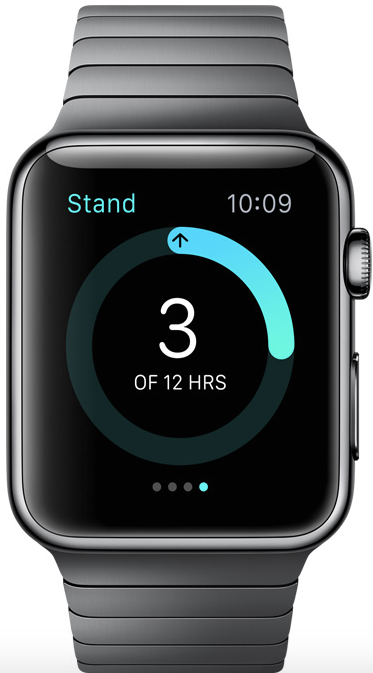
The biggest fitness app really isn’t an app at all, but a built-in feature to the watch. Apple Watch is chock full of fitness and activity tracking options including a workout app, basic step and burned-calorie counters, and will even feature reminders alerting you when it’s time to stand up and walk around a little.
Third-party apps will also be available for tracking fitness. Offerings from Nike+ Running, Strava, and Runtastic are also being featured on Apple’s web site. Data from Watch will be synced with these services, allowing users more access to and control over their data.
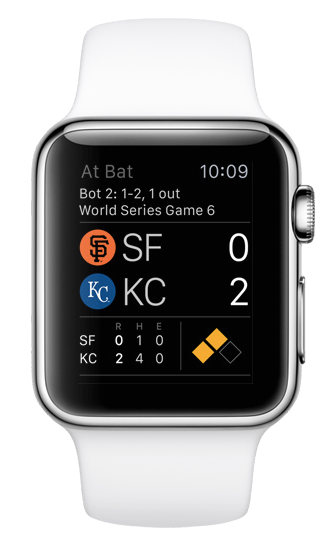
So far, only two apps for sports fans have been announced — MLB At Bat and ESPN. Both will feature team-/game-based notifications and general scoreboard functions, while the At Bat app promises player stats, news, and even highlights. I have to admit, watching highlights on a watch would be pretty cool.
Apple has released the iOS update that features the Apple Watch app, but as of this writing access to the Watch App Store was not available. Nevertheless, the Watch API has been out for some time, so it’s easy to assume there will be plenty more offerings above what has been announced today. We’ll keep you updated as soon as we get any more info.
The Apple Watch will be available for preorder on April 10th, with units becoming available on April 24th.
Since we last visited with startup i1 Biometrics, developers of the Vector mouth guard which measures the level and location of each hit on the football field, the demand and the market for their product has grown significantly. Yesterday i1 announced a new partnership with Texas A&M football. Already partnered with the University of Kansas, Louisiana State University as well as the University of South Carolina, i1 Biometrics is making strides to measure potentially concussion inducing levels of impacts.
The Vector mouth guard itself measures rotational and linear impacts and then sends the impact data in real time to to the coaching and training staff where it is stored in their cloud computing for easy access. Notifications can be sent to mobile devices for immediacy or the information gleaned from the mouth guards may be accessed online through a phone or computer.
In a joint study between Harvard University and Boston University last year covering 734 NCAA football players from the 2013 season, the concussion numbers are jarring, and not just the speed of the impacts. The players claimed six potential concussions and 21 “dings” for each confirmed concussion.
Given what is already known about the long-term effects of concussions — and even more alarming is what is unknown — seeing front-line collegiate football teams taking things more seriously is a step in the right direction.
 These subscription-based numbers are missing free-to-play League of Legends and Dota 2, arguably the two biggest multiplayer games in the esports scene. LoL is known for its massive following and Dota 2 is famous for its huge userbase and even bigger prize pool at the yearly tournament known as The International. Esports have become mainstream when the dollars being thrown around rival that of not only major sports franchises, but entire leagues.