How to Split Strings of Sports Data into Individual Cells in Excel
This is a really simple trick that I think a lot of people will never need, but a few people will love forever. It’s this problem:
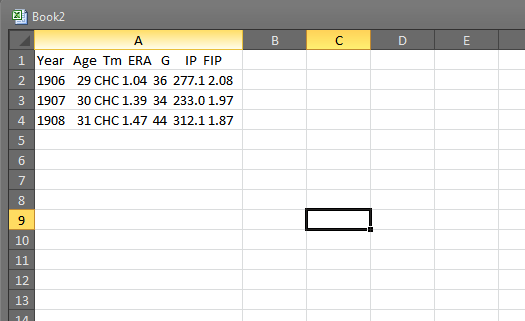
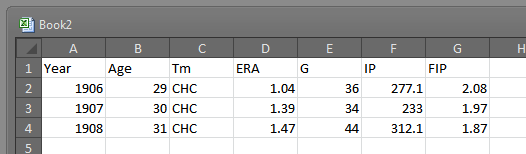
Year   Age  Tm  ERA   G     IP  FIP
1906    29 CHC 1.04  36  277.1 2.08
1907    30 CHC 1.39  34  233.0 1.97
1908    31 CHC 1.47  44  312.1 1.87
Here’s Mordecai Brown’s 1906 through 1908 stats from Baseball-Reference. But some nimcompoop has pasted them as pre-formatted values. Paste this biz into Excel and you get something like this:
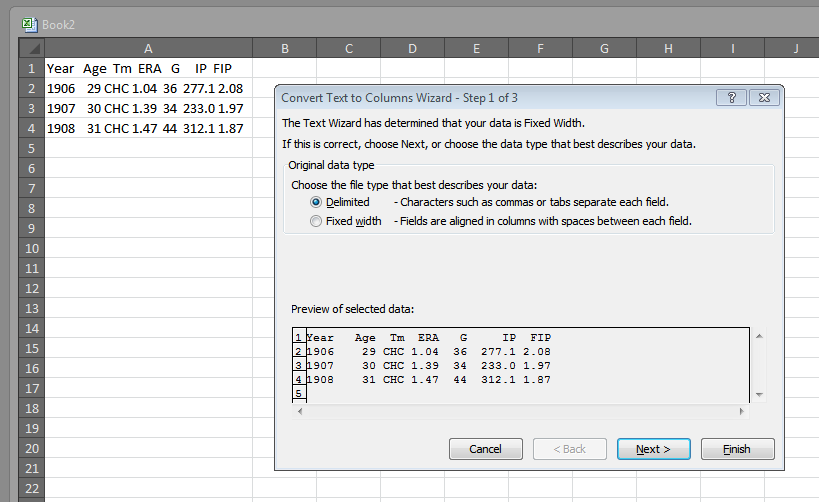
Well, you’re in luck. Because there’s a super easy way to make this into legit data. Go to the appropriately-named “Data” tab and you’ll find the “Text to Columns” function:

With the data selected, click on this “Text to Columns” button. A pop up window will then prompt you whether you want to treat the text as “Fixed width” or “Delimited.” These concepts are weird-sounding, but actually quite simple:
- Fixed-width: The data has spaces inserted into it so that it visually lines up. When you’re pasting from pre-formatted text, this is almost always the right choice.
- Delimited: This is text that has special characters within it to help signify the differences between columns. So, if you’re pasting something from a CSV file (a file that uses commas between each data point), then delimited would be the right choice. You can also use delimited if there are spaces between data points — and this can be very helpful when translating a list not intended for spreadsheet use into a spreadsheet.
For this instance, let’s use Delimited to see what happens:
Step 2 asks us what our delimiters are. We can choose one of the usual delimiters (like tabs and commas) or we can use spaces or even insert our own characters (this can be usual for when, say, we scrape data off a Korean baseball site and special Korean characters divide the columns).
With “Tab” selected, you’ll probably notice the data in the preview box doesn’t change — as in, there are no vertical lines indicating the creation of new columns. If you click the “Space” box though, you should see something like this:
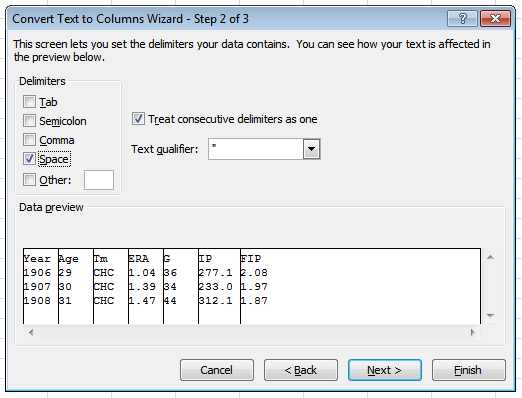
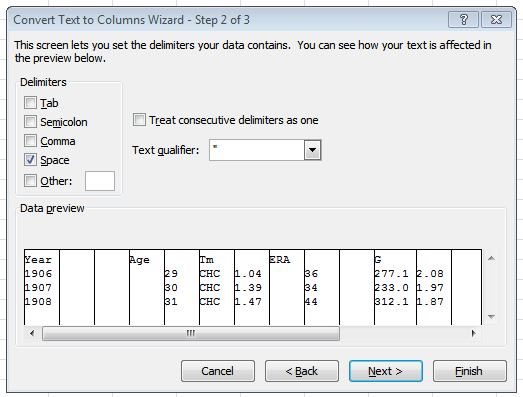
Note the check next to “Treat consecutive delimiters as one.” That is important, because without it, we end up with a lot of columns we don’t need:
In the third step, we have the option to change the data formats and choose an alternative location for the new separated data to appear — both of which are handy — but in general, our work his here is done. Hit “Finish.”
That should give us something like:
So, the alternative to delimited data is fixed-width. Let’s go Pro on this thing and used the fixed-width setting. But this time, I’m going to use data from my Scoresheet league. I encourage any other Scoresheet users to play along with their own data.
I really like Scoresheet. It is one of the very few fantasy baseball sites to include defense. In fact, it might be the only one. But it has problem. The site’s interface was designed by DARPA to fend off the Soviets, or at least that’s what it feels like:
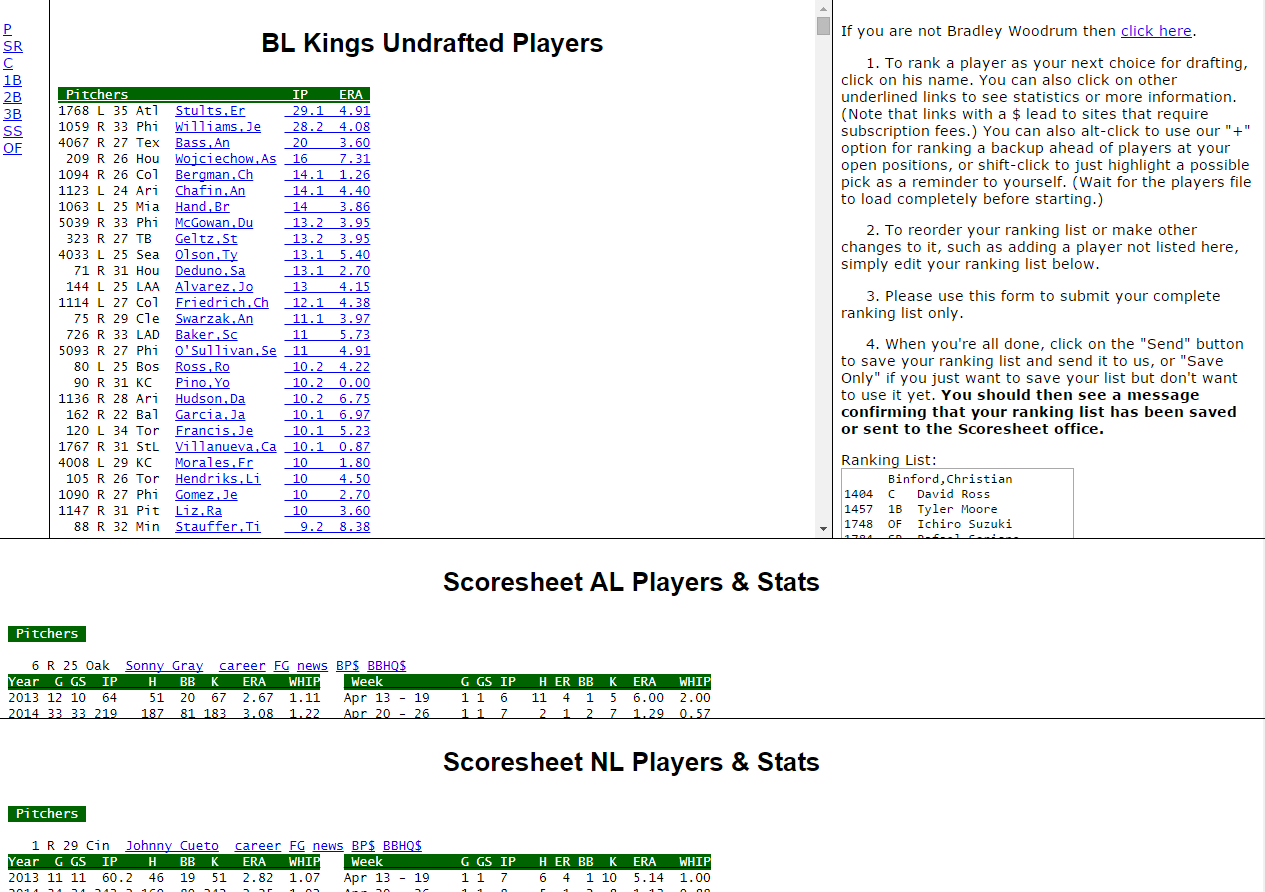
So, here’s my undrafted players list (and before you league-mates start thinking you’ve got a peak at my undrafted players list, just know: I’m no longer in the market for a second catcher or extra bat, so ogle all you want). In the middle, big frame, I have a list of players organized first by position and then by playing time accrued (i.e. their real world stats). But what I want to do is combine this data with, say, some projection data like the FanGraphs Depth Charts leaderboard.
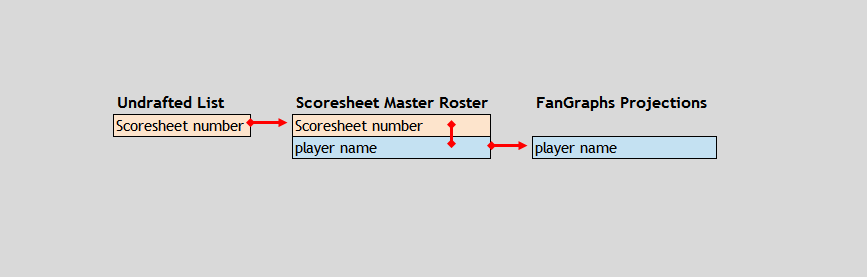
But in order to match these undrafted player with the FanGraphs DC projections, I need to first suss out the names of the players. I can achieve that through scraping the numbers of available players here in this undrafted screen and then combine them with the Scoresheet master roster (downloadable here).
For those keeping track at home, I’m combining data like this:
We need to scrape the data from the undrafted list. This amounts to clicking in the middle frame of that previous screen, pressing CTRL+A (select all) and then CTRL+C (copy).

Pasting that into Excel gets something like this (note, I deliberately pasted using source formatting):
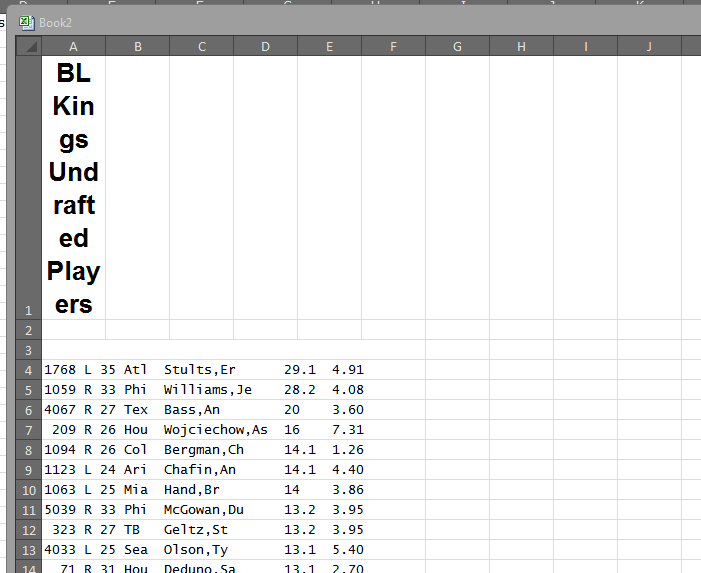
First, we can get rid of those top two rows. Really don’t need them. BUT DON’T DELETE THAT THIRD ROW. We need that.
Let’s go ahead and split our data. Select the entirety of Column A (just click the “A” at the top). Then run our handy converter (Data > Text to Columns). This time, let’s go with Fixed Width (though, once again, we could probably make it work with either).
We see reach a screen like this:

The key here is that the numbers on the far left are isolated into their own column. It’s fine that the word “Pitchers” is getting sliced into multiple columns; we don’t really need it anyway.
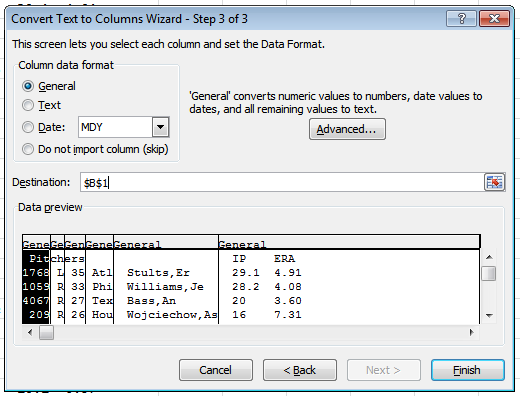
Scrolling down the preview panel, I can confirm that all the numbers are indeed isolated into the far left column. Now I’m going to actually use the Step 3 of the conversion wizard.
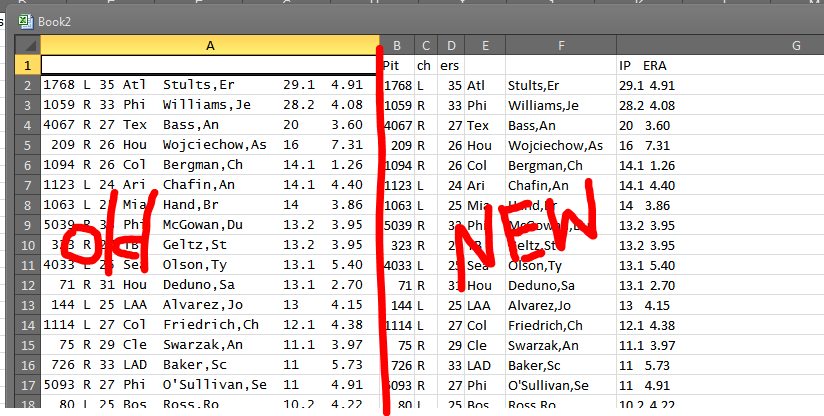
In Step 3, I can choose an alternative destination for the conversion. I want to do this. So I’m going to change the “Destination” section to the next available column — in other words, change it from $A$1 to $B$1:
Great! Now I’ve got my data separated out:
Now I want to get rid of all the blank or white-font lines. These are leftovers from the column titles on the Scoresheet website. First I select all the data (CTRL+A and then CTRL+A again to select everything), and then I sort by the first column.
Sorting Z to A, I find — midway down the data — this blank spot where white-font titles have gather together:

After I purge those rows, the data should be clean. Row B should be nothing but numbers. Beautiful, delicious numbers.
So let’s go back to the top and add a title row. I really only need the first two columns for this, so I’m going to name them Original and Number and then delete the rest. Then I’m going — once again in the “Data” tab — add filters (Data > Filter). If you had any one of the data cells selected (i.e. not a blank cell selected), then Excel should add a neat little pair of gray arrows at the top like such:
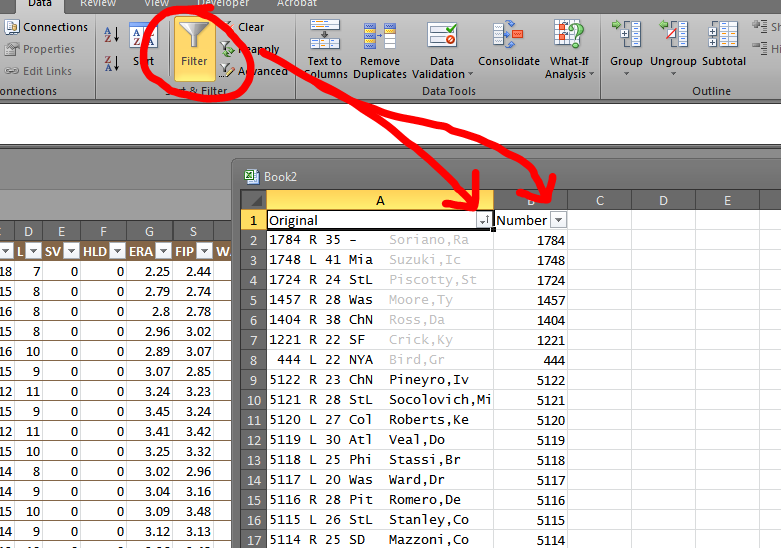
You may also notice my data is already sorted in the preceding image (note the little up arrow inside the gray box). But this data is clearly not sorted numerically or alphabetically — No. 444 Greg Bird is near the top. It is sorted, however, by color.
See how the items with gray fonts are now all in the top together? These are players already drafted or selected for my queue. This is why we need the original formatting in the first pasting job.
So now I’ve got my numbers isolated. Using VLOOKUP (or INDEX and MATCH), matching these players to their full names should be a cinch (also, a CONCATENATE formula will help join the first and last names of the players). And with first and last names, we can do one more VLOOKUP / INDEX-MATCH to join them to their projections.
The net result, with some formatting and careful data pollination, can look something like this:

Now the real trick will be for me to find a way to hide this article from the guys in my league.
Wonderful stuff as usual Bradley. Side note: I haven’t really had time to play fantasy the past couple years, but Scoresheet seems basically like an online OOTP league that uses current week stats instead of past performance, that sounds pretty awesome. The only thing I saw that I probably wouldn’t like is no live drafts, just makes it seem like you don’t have real, full control of your team.
I’ve always wondered how to tie together two different data sources and match up data sets. I’ve never used VLOOKUP, will have to check out that article you linked. Thanks!
I did know abou that Text Conversion in Excel, and agree that it is WONDERFUL, but wonder if any such function exists in Google’s Sheet application. Are you aware of any? Or if there is another way to get it done in that app?
Well I can’t recommend this article enough:
http://www.techgraphs.com/using-vlookup-for-sports-data/
The author is like stupid handsome.
Yes, he is quite the handsome dude, I agree.
And thanks for the link too!
Tech Graphs keeps bringing excellent content. This article and the VLOOKUP article are phenomenal. If my leaguemates are reading I am about to lose what I consider to be one of my big edges in the fantasy game: facile number crunching and indexing 🙂
Thanks! I’m glad you liked it.
Now go forth and outnerd everyone, outnerd them to their graves.
An important note here (just in the very very rare case that this is something you’d encounter) is that this CAN be automated in VBA as a macro (which is what you had to do in the bad old days). Now, if the set has enough “rows” to be an issue it’s probably stored in a .csv friendly framework.
If you’re using something like R to analyze data, the original csv is just going to be more efficient to work with. I’m not sure it’s ever a problem in MLB contexts, but on the SMALL side sportsVU data is a gig per file, which simply won’t open in excel. I’m actually not sure about that- though I can guarantee 8 gigs won’t open from experience. In most cases I think Excel is great. Once the data starts getting medium sized, though, it starts to get slow. If you’d like a deeper primer on how to clean data, btw, Johns Hopkins BioStat has a FANTASTIC coursera course on data science.