An RPI Spreadsheet for You; Yes, You!
A Rating Percentage Index (RPI) can be a powerful tool in assessing a team’s quality when a team’s schedule may differ wildly from its peers. RPI calculations are critically important in collegiate athletics, when the No. 1 and No. 2 teams in the nation have few or no shared opponents. RPI helps adjust for that curiosity.
Simply put, RPI is this:
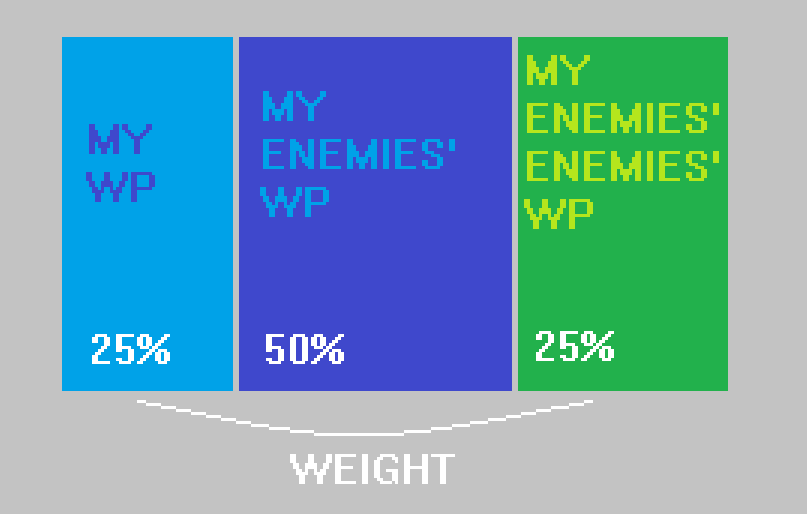
The formula, in formula mode, is:
RPI = (WP * 0.25) + (OWP * 0.50) + (OOWP * 0.25)
Where:
- WP = winning percentage
- OWP = opponent’s winning percentage
- OOWP = opponent’s opponent’s winning percentage
What’s great about RPI is its intuitiveness and its simplicity. Though it might benefit from information like margin of victory or home field advantage (something it can account for and does in the the NCAA basketball calculations), RPI is simply an attempt to adjust for quality of opponent. It does a decent job of answering the question: “What if everyone played each other?” in a league setting where that’s impossible.
We can then use RPI for:
- rec rugby teams with unbalanced schedules
- ongoing office ping pong tournaments
- high school, middle school, and rec league teams of all sports
- Madden records with friends
- any environment where two parties battle and one wins
Here’s the file:
NOTE: Don’t download this if you don’t trust me. The file is an Excel file with macros; these can be powerful. I encourage you to trust me, but in general, practice caution when opening an macro-enabled Excel file from a stranger on the Internet.
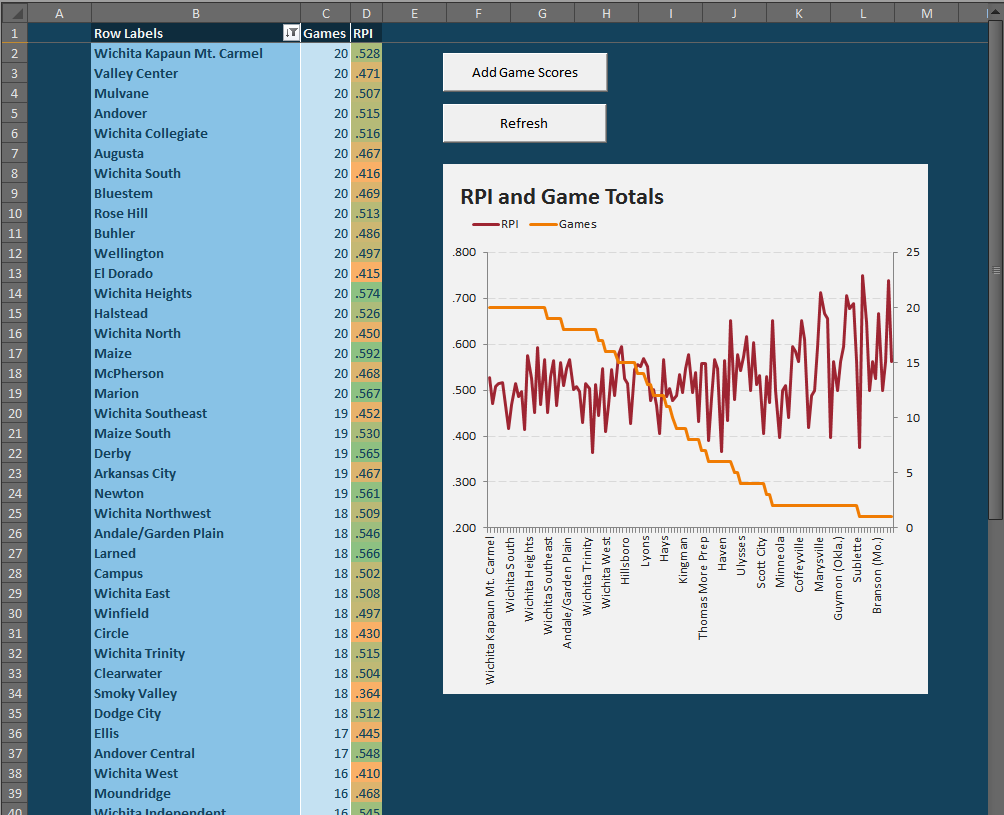
When you open the file, it should look something like this:
If you want to jam in the results from your weekend of one-on-one basketball games, just click the “Add Game Scores” button. This will produce a list popup where you can add and remove game results:
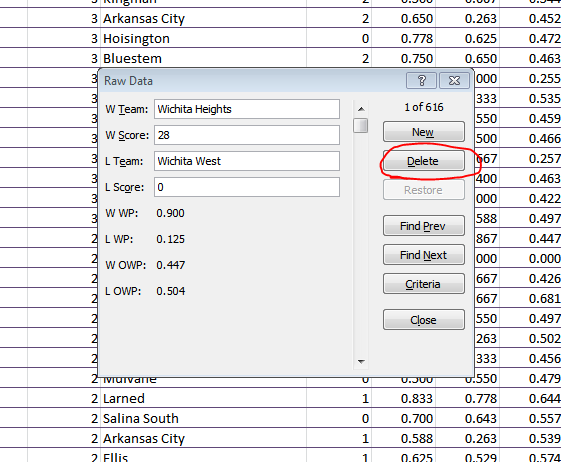
You can speed this process up by unhiding the “Raw Data” tab and deleting the unwanted rows of data. But be sure to preserve at least one row so that the final four columns retain their formulas.
To add a new score, you’ll want to click “New” immediately, then fill in the blank spots. NOTE: You don’t need to put in the scores, but since nothing is password locked in this doc, you may want to save those in case later on you feel frisky and want to add some margin of victory inputs somewhere. Once you have input the records you desire, click “Close.” We will now need to refresh the calculations, so press the big, appropriately-titled “Refresh” button. ALSO NOTE: You will likely need to adjust the row filters.
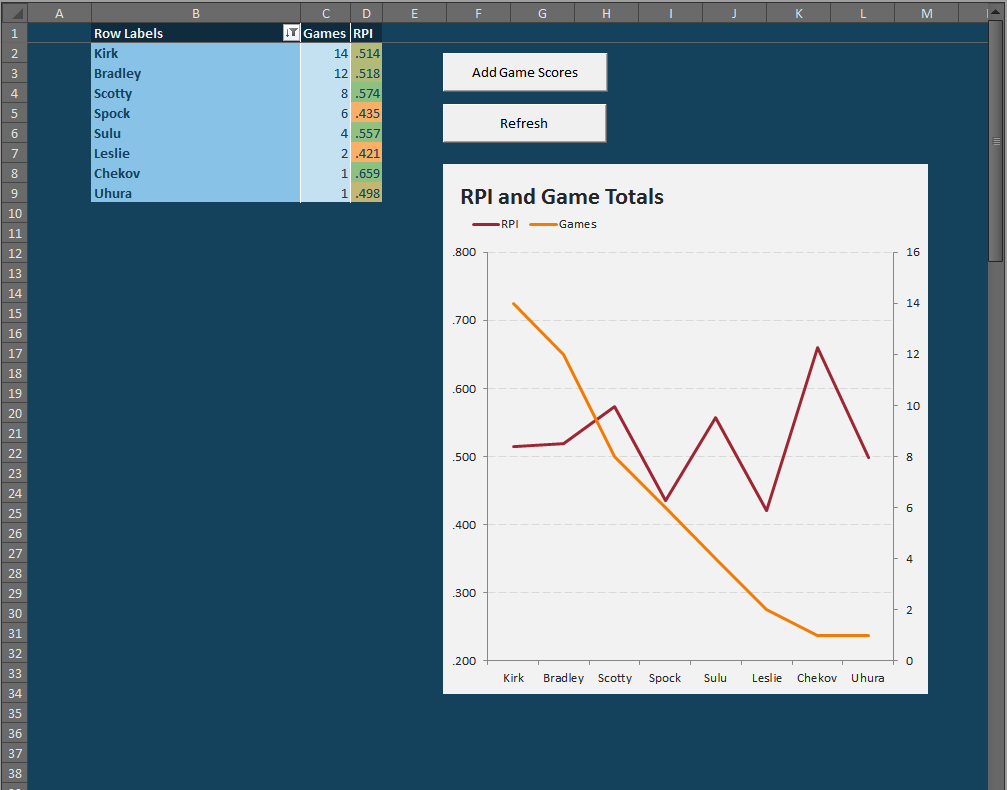
The end result should be something like this:
If we want to drill deeper on the data, we can unhide the “Prep” worksheet, which will show each RPI and the three components that go into it.
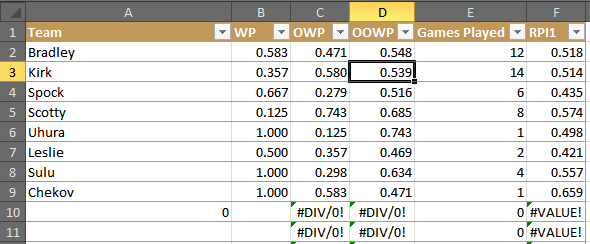
Analysis:
- Chekov may have the largest RPI, but he played only one game of Tri-Dimensional Chess — a game which he won, obviously. That’s why it’s important to note the Game Played when looking at RPI (or WP, for that matter). His one victory game against me, which is ultimately neither a big help nor hindrance because my RPI was merely .518 — so his one victory came against a mediocre player.
- Despite winning 2 out of every 3 games, Spock’s weak competition (2 wins against Scotty, 1 against Kirk and myself) and his losses against Scotty and Kirk, undermined his otherwise impressive record.
- The best player was probably Scotty, who lost a ton, but nevertheless beat Spock. Moreover, many of his losses came at the hands of undefeated Sulu, undefeated Uhura, and the formidable Kirk. If Scotty chose his 8 opponents better, he could conceivably have been the best player.
Analysis of the analysis: If you think these results seem skewed to favor the smaller samples, you are right. That is one of the dangers of RPI. Review that very first RPI chart. The lower the orange line (i.e. the fewer games played), the more upwardly skewed the red line (i.e. the more likely for a bias towards high RPIs). The systems settles down around ten games, so I would consider that as good an arbitrary cutoff as any other number.
If we cut off our Tri-Dimensional Chess club rankings at a minimum of 10 games played, we can comfortably assert that I’m marginally better than Kirk — and that Scotty could be possibly better than us both.
Anyway, that’s the RPI Tool. I hope you enjoy it. Please let me know in the comments if you encounter any problems. I’ve not password locked anything, so feel free to do whatever with the spreadsheet.
Thank you and thank you
Love the use of Kansas high schools as your example. Although the RPI there has Marion and Larned a bit too high…
How could I add margin of victory as an added component?
How are you calculating OWP? We used your spreadsheet for our basketball league (thanks, by the way) but we get a different number for OWP when we do the calculation by hand. In our manual calculations we followed the description outlined on Wikipedia for OWP…….The OWP is calculated by taking the average of the WP’s for each of the team’s opponents with the requirement that all games against the team in question are removed from the calculation
Love your excel sheet. I was testing it out on DI basketball scores and after a certain point i start getting errors. Is there a limit to the amount of teams that can be entered?
I couldn’t get it to work, but I am using Openoffice. Is it compatible with Open office?
Works great on excel, thanks! You should add the ability to include ties/draws to the calculation or it will not be able to do soccer or similar scores..
Thanks for all the hard work. Tested it and it works great. Then I started entering results and realized on the second entry that it would not work for soccer. Agree with Todd that it needs modification to account for draws.